IEEE TRANSACTIONS ON PLASMA SCIENCE, VOL. 34, NO. 2,APRIL 2006
Three-Dimensional Modeling of a Direct
Current Operated Hg-Ar Lamp
Khokan C. Paul, Member, IEEE, Tetsu Takemura, Tatsumi Hiramoto, Masaki Yoshioka, and Tatsushi Igarashi
Invited Poper
Abstract
This paper describes a three-dimensional (3-D) numerical model, first of its kind, for predicting the plasma behavior of high pressure (viz. high-intensity discharge (HID) and ultra high pressure) lamps. Two-dimensional (2-D) and axisymmetric plasma models are widely used as these are less complicated and fairly available. But 2-D and axisymmetric models are not useful for any lamp operation other than vertical burning. There are many systems where HID lamps are horizontally oriented and/or inclined. Therefore, a universal 3-D model is a must for the proper predictions of such lamp behavior. The developed plasma model solves the complete set of magnetohydrodynamic (MHD): transport equations of mass, momentum, and energy along with the vector potential form of Maxwell’s equations to account for the electromagnetic effects. Radiation of the energy balance is calculated using the P-1 radiation method by dividing the electromagnetic spectrum into several graybands. For presenting the model performance, calculations are done for a lamp having arbitrary geometry and operating conditions. The glass-bulb of the lamp is assumed ellipsoid and the interelectrode gap is taken as 5 mm. Although the model has the features of predicting properties of the whole domain (electrodes with nonequilibrium cathode-sheath, 3-D plasma region, 2-D glass bulb, and stems), we limit the presentation for the electrodes and plasma region only to control the article size. Operating conditions of the lamp are chosen as a direct current (dc) of 20 A, a discharge medium of Hg and Ar mixture, and an operating pressure of 0.11 MPa. Current levels of 30 and 40 A have also been used to predict the current effect on radiation output. Calculated plasma results show a clear deviation from axisymmetry for horizontal operation of the lamp. Temperature and other plasma fields are found as the strongest near the cathode tip. Effect of Lorentz forces on the plasma velocity is found very significant. For the case of 20 A, maximum temperature is found as about 11000 K and the maximum velocity as 6 m/s.
Index Terms-High intensity discharge (HID) lamp, magneto-hydrodynamic, Maxwell’s equations, mean absorption coefficient, P-1 radiation model, spectral band, vector potential.
I. INTRODUCTION
TODAY, high-pressure (high-intensity discharge (HID) and ultra high pressure) lamps are in significant applications around us. It ranges from general lighting to automotive lighting, video projection, photochemistry, lithography, microscopy, etc. With the rising demand of these lamps, as well as with the requirement of high reliability and efficiency, research endeavour on such high pressure lamps has been increasing continuously.
Numerical investigations on high-pressure lamps are increasing gradually because of technical difficulties associated with the experimental investigations that are also very expensive. Although some articles on experimental investigations are available in literature, they have produced partial information like modes of arc attachment with electrodes [1]-[3], electrode falls [4] -[6], work function of electrodes [7], spectroscopic measurement of plasma and boundary-layer temperatures [8], [9], etc. These revelations are, in general, informative and scientifically valuable for the dealt-particulates but insufficient for overall lamp understanding. Because they are not enriched collectively with the discharge properties, glass bulb behavior, radiation output from lamp, and so on. Moreover, experimental investigations are usually very expensive. For these reasons, theoretical investigations of high-pressure lamps have been progressing rapidly. Today, many lamp companies are either applying such models in rapid lamp development or working toward development of adequate models. A good theoretical model can estimate the overall behavior of high-pressure lamps and, therefore, is very helpful to new lampdevelopers.
Two-dimensional (2-D) and axisymmetric models [10] -[18] are relatively easy to develop, computationally less expensive, and widely used. In some reported 2-D models [13]-[18], further simplification has been done by neglecting flow or convection. Application of these flow-less models into high wattage (>1 kW) and/or very high pressure (>1 MPa) lamps may give poor prediction.
Axisymmetric and 2-D models are essentially good in predicting the behavior of high pressure lamps if the lamps operate vertically. In such orientation, the gravitational effect does not disturb the axisymmetry of lamp appreciably. But when the lamp operates in horizontal orientation, axisymmetry does not prevail and a complete spatial model [three-dimensional (3-D)] is necessary. There are many situations where HID lamps burn horizontally. Projection (ultra high pressure: above 10 MPa)lamps are good examples that operate in horizontal orientation. Very high pressure (~10 MPa) lamps also operate in either horizontal or inclined position.
Around the 1990s, Shyy et al. [19] reported a 3-D model for studying mercury lamp behavior and it has been applied for different parametric investigations [20]- [22]. In their model, near-electrode regions or sheaths have not been accounted for. Also, the momentum effect due to self-induced magnetic field has been neglected, which is likely to play significant role, especially near the electrode tips. They have made a very simple treatment of radiation for the energy balance as the computation of radiation transport has been realized impractical due to the requirement of enormous computing time.
This work is devoted to develop a self-consistent model for predicting behavior of high-pressure lamps that are filled with mono-atomic gases. The model has an outstanding feature of 3-D predictability for the plasma or gas-filled region. It accounts for the cathode-sheath, electromagnetic momentum effect on plasma, and improved radiation through the implication of P-1 radiation model. In this primary approach, regions other than fluid of the lamp are modeled in 2-D, axisymmetric approach although situations at the electrode tips may differ from axisymmetry and thus the predictions of those regions may have little discrepancy with practical behavior.
The developed model for high-pressure lamp has the capability to deal with the whole lamp (viz. electrodes, plasma, glass-bulb, stems, and lamp house). However, the contents of this paper are limited to the plasma and electrodes including the cathode sheath. The cathode sheath or near-cathode region, which is about 100µm thick, is modeled in one-dimensional (1-D) and nonequilibrium assumption. The sheath model is docked between the 3-D plasma and the 2-D and axisymmetric cathode model. In developing the calculating scheme, a vendor-supplied software package, called Fluent [23], is used as the computing platform. Fluent is a computational fluid dynamics (CFD) package. Most physical models of our model are solved using customized modules of Fluent.
We have arranged this paper to describe the model of different sections and to show the performance of it in a lamp geometry that fundamentally differs in geometry and operating conditions with any commercial lamp. The considered geometry and operating conditions are chosen for presenting the developed model but may not suit for industrial application. In the chosen geometry, glass-bulb of the lamp is assumed as ellipsoid and interelectrode gap is taken as 5 mm. The discharge medium is a mixture of Hg and Ar with an operating pressure of 0.11 MPa. Mass concentration ratios of Hg and Ar are set to 91% and 9%, respectively. Lamp is operated by a direct current (dc) of 20 A. For the considered operating pressure, we shall refer our work for a discharge lamp but not for a high pressure or an HID lamp, where the operating pressure is more than an order of higher value.
II. DETAILED MODEL DESCRIPTIONS
The feature of the model is such that it can predict the properties for the whole region of the lamp between two power-supply ends. However, we discuss here the plasma and electrode sections, including the cathodesheath model. The key feature of this work is the presentation of a physically-enriched 3-D model for the gas-filled region. Electrodes are modeled in 2-D and axisymmetric approach. The thin (~100µm) near-cathode region or cathode-sheath stays in nonequilibrated condition and hence the model of this region is based on 1-D and nonequilibrium approach. Model descriptions for the cathode-sheath, electrodes, and plasma are outlined below.
A. Near-Cathode or Cathode-Sheath Model
Investigations on plasma-cathode interactions have been advanced substantially over the last few years [16], [24]-[30]. This work is based on the model proposed by Benilov and Morotta [24] with some modifications: ion motion across the space-charge sheath is assumed collision-dominated (a fair assump-tion for high pressure discharge), physics of the sheath is described by means of [28], and rigorous balance for heat flux at the cathodeplasma interface is confirmed in the solution. The model is explained here briefly and the details are to appear in other contemporary or future publication by this author and his colleagues. The model assumes a cathodeplasma layer with a thickness of few tens of micrometers and it consists of the pre-sheath or ionization layer and the sheath or space-charge layer. An energy balance equation for electrons in the ionization layer is solved that has the following expression:
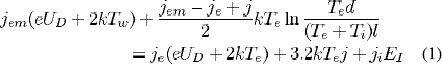
where, the current density magnitudes due to electron emission (Jem) from the cathode surface, electron counter-diffusion (Ji) from the plasma to the ionization layer, and ion flow (Ji) from plasma are described as
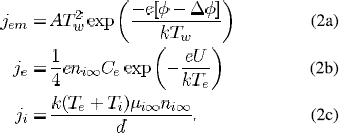
Second term of the left-hand side of (1) is proportional to the potential drop of the preshath or ionization layer Ui which has the following expression:
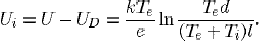
Here,UD and U are voltage drops in the sheath and near-cathode layer (sheath + presheath), respectively;Te,T and Tw are the electron, ion and cathode surface temperature, respectively; e is the electronic charge; k is the Boltzmann constant; I and d are lengths defined in [28]; A is the Richardson’s constant; φ (2.855 eV for thoriated-tungsten cathode with the surface coverage degree 1 [31]), and Δφ are the work function of the cathode material and Schottky correction respectively; Ce is the electron’s mean thermal speed;EI is the ionization energy of atomic mercury (10.43 eV); and ni∞ and µi∞ are the ion density and mobility, respectively, at the edge of ionization layer and bulk plasma.
After solving the nonlinear equation for given potential U and cathode surface temperature Tw, the net current density (j = jem + ji - je) and the net energy flux from the plasma to the cathode(q = qe + qi - qem) are calculated. Expressions for the energy flux components are as follows:
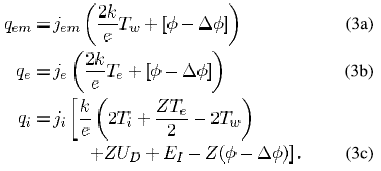
Here, Z is the ion charge number. Due to very lower ionization potential, mercury in the Ar-Hg mixture ionizes readily with temperature rise and, therefore, mercury’s partial pressure of 0.1 MPa is used in calculations of the cathode-sheath model.
The net current density and energy flux are stored in lookup tables as functions of cathode surface temperature (Tw) and po-tential (U). These tables are used in modeling the bulk cathode by which the current density distribution for a given current and temperature distribution at the cathode surface are obtained.
B. Electrodes Model
Electrodes are modeled in 2-D and axisymmetric approach. Energy balance and current continuity equations, of the following form, are solved for both anode and cathode with appropriate boundary conditions, explained in Section III.
Energy conservation
Current continuity equation

where, ∇ is the vector operator;  and σ are the thermal and electrical conductivity respectively;Cpand H are the heat capacity and enthalpy respectively;
  is the current density and obtained from the following relation:

and V are  the electrostatic potential and electric field intensity vector, respectively.
C. Plasma or Gas-Filled Region Model
Except the cathode-sheath model, all other models are based on local thermodynamic equilibrium (LTE). For a discharge of atmospheric or higher pressure, LTE assumption is fairly good. The 3-D model of plasma region solves the complete set of magnetohydrodynamic (MHD): transport equations for mass, momentum and energy along with the Maxwell’s equations.
Mass continuity

Momentum conservation

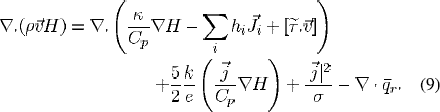
Energy conservation
Chemical species conservation for Ar

Solution of argon mass concentration automatically calculates the mercury mass concentration since the total mass concentration of Ar and Hg is 1.
Vector potential equation

where, p is the mass density;  is the velocity vector with axial, radial, and tangential components; p and are g the pressure and gravitational acceleration, respectively;
  is the stress tensor;
  is the radiative flux; hi and
  are the enthalpy and diffusion flux, respectively, for species i (Hg or Ar); mAr,
  are the local mass concentration and diffusion flux, respectively of Ar ;
 is the vector potential; and µ is the permeability of free space.
  of (8) is the Lorentz force that is calculated from the following relation:

where,  is the magnetic field. In plasma also, the current continuity equation [(5)] is solved and the current density is obtained from the relation of (6). The magnetic field has been calculated as

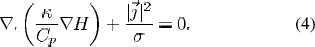
For the radiation energy (the last term of the righthand side of the energy equation), P-1 radiation method [32], [33] is used for spectral bands. Among many radiation methods, discrete ordinate (DO) method is understood to produce better results and has been suitable for both optically thin and thick media. But this method is computationally too expensive. P-1 method is rather good to optically thick medium and easy to implicate even in complex geometry. In Fluent (version 6.1) package, P-1 method is found as the best fit for our system. In this Fluent version, P-1 method has the option of using temperature-dependent absorption coefficient but DO method does not. Spatial temperature variations are rather drastic in HID lamps and, therefore, temperature-dependency of absorption coefficient is significant. For band y, P-1 expression is as follows:

Here,  , By and Gy are the mean absorption coefficient, Planck’s function and mean incident radiation of band y . The total radiative energy is the algebraic summation of all bands
This work includes the electromagnetic spectrum from ultra-violet to the infrared (100-20 000 nm) region and the spectral range is divided into five bands. The bands cover the wavelength range of 100-119 nm, 119-680 nm, 680-1200 nm, 1200-4500 nm, and 4500-20 000nm. The divisions are done such that variation of absorption coefficient for continuum radiation over a band is small. This is the criterion proposed in adopting the mean absorption coefficient method [34].
The mean absorption coefficient accounts for the contributions of both continuum and lines. Continuum absorption is due to the radiative recombination and bremsstrahlung (electron-ion and electron-atom interactions). Line absorption coefficient is calculated using linebroadening for appropriate line profile (Gaussian, Lorentzian, or Voigt) and escape factor for all absorbed lines. We have, however, neglected the contribution due to nonabsorbed line, which is usually insignificant. 22 atomic and two singly-ionized lines are considered for mercury and 11 atomic lines are chosen for argon.
III. BOUNDARY CONDITIONS AND CALCULA TION PROCEDURES
The 2-D schematics of the lamp geometry that is used for illustration purpose of the developed model are shown in Fig. 1. Tangential geometry along z coordinate of the 3-D system is just the replica of the radial geometry in y coordinate. The glass bulb is ellipsoid and the interelectrode gap is 5 mm. Developed calculating scheme is based on separate modeling of anode, cathode, plasma, glass bulb, and stems. Consistent result at the boundaries of sections is obtained through a back and forth iteration scheme. This domain-to-domain iterative scheme has been chosen for the implementation suitability in Fluent (version 6.1) package. As was mentioned above, discussed results of this paper are for the plasma and electrodes only. Boundary conditions and applied calculation techniques for cathode, anode and plasma sections are outlined below.
A. Cathode
The modeled cathode domain is ABCDH (Fig. 1). Solution of this region is taken as converged when the summation of the energy fluxes around the cathode surfaces is zero, i.e.,
Boundary conditions on surfaces and/or interfaces are mentioned below.
On ABC: Initially an assumed potential (say V1 ) is specified. For this specified potential, the solver reads heat flux from the lookup table, which has been produced by solving the cathode-sheath model, corresponding to the calculated real-time temperature. When the converged solution is finished, the current density distribution is obtained from the lookup table. Knowing the current density distribution, the total current at the surface is calculated. The total current, thus, obtained for may V1 not be equal to the desired lamp current. In such a situation, it is necessary to change V1 repetitively until the calculated current is the same as the lamp current. In this particular case, a potential 12 V has produced the total current as 20 A (the lamp current). This potential is referred as the cathode fall.
On CD: Current density as zero and a guessed temperature profile are specified in the first step solution. In the subsequent steps of iterative scheme, the temperature boundary condition is changed to heat flux, which is obtained from plasma solution.
On DH: A current density corresponding to 20 A and a constant temperature of 650 K are specified.
Solution of cathode model produces the current density and temperature distributions at the cathode/plasma interfaces. Fig. 2 shows such distributions. Note that these distributions are obtained from the final step of the cathode-plasma-cathode iterative scheme. It can be seen that current carrying region extends beyond the tip (AB) and spreads over the taper region (BC). These distributions are used as boundary values in solving the plasma model.
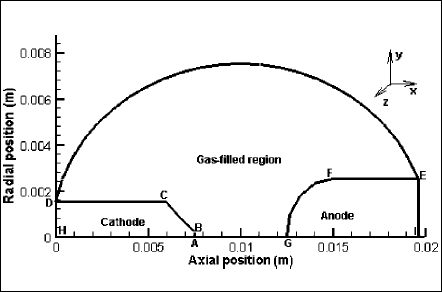
Fig. 1 Schematics of the lamp geometry: ABCDH is the cathode domain, GFEI is the anode domain, and ABCDEFG is the gas-filled or plasma region.
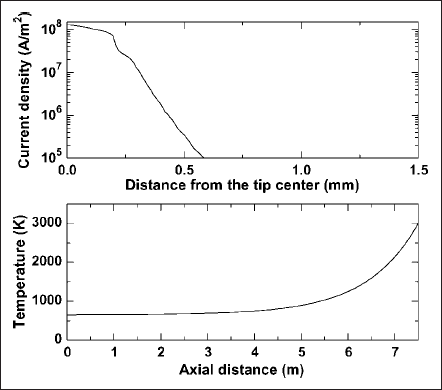
Fig. 2. Current density distribution on ABC surface and temperature distribution along the axial direction of the cathode.
B. Anode
The modeled anode domain is GFEI (Fig. 1). Converged solution for anode also has the same criterion that the summation of the energy fluxes around anode surfaces (GFEI) is zero. Boundary conditions of anode surfaces are as follows:
On GF: An arbitrary reference potential (viz. 0) and a heat flux distribution are specified. The flux is the summation of the flux due to current flow (j.φ;φ is the work function of pure tungsten, the anode material, and it is 4.5 eV), flux due to electronic enthalpy, flux due to net radiation of the surface and flux due to convection. All these components are obtained after plasma solution.
On EI: Acurrent density corresponding to 20A and a constant temperature of 650 K are specified.
Back and forth iteration between plasma and anode domains is done for unaltered temperature distribution at the anode-plasma interface. Fig. 3 depicts the temperature distribution obtained along the axial direction of the anode surface. This distribution is used as boundary condition in the last step of plasma solution.
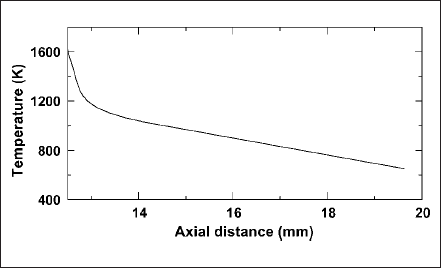
Fig. 3 Temperature distribution along the axial direction of the anode.
C. Plasma
The modeled plasma domain is ABCDEFG (Fig. 1). Boundary conditions for energy and current continuity equations at the cathode-plasma and anode-plasma interfaces are obtained from the solution of cathode and anode model, respectively, as explained above using Figs. 2 and 3. On the glass boundary (DE), a zero current density and an assumed temperature profile of 650 + 25sin (π.z/15)K are used. Diameter of the ellipsoid-bulb is 15 mm and z is the tangential distance;the temperature is assumed to vary sinusoidally with tangential distance. Maximum bulb temperature is 675 K at the top and minimum is 625 K at the bottom of the lamp. An assumed temperature profile at the glass-bulb apparently limits the accuracy of the results but a solution of glass-bulb model (an issue of next publication) will improve it. For solving the P-1 equation, Marshak’s boundary condition [10] is used at all boundaries to specify boundary flux for mean incident radiation
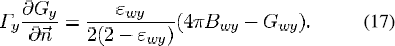
Here, Γy(= 1/3 ) and εwy are the diffusion coefficient and mean apparent emissivity of wall, respectively, for band y.
 is the outward normal vector.
The material (mass density, enthalpy, heat capacity, viscosity, electrical, and thermal conductivities) and optical (mean absorption coefficient) properties of the gas mixture are taken from the work of Paul et al. [10]. Optical properties of glass and electrode are obtained from [35]-[37] and [38]-[40], respectively. These values are arranged for bands as mean value.
IV. RESULTS AND DISCUSSIONS
Fig. 4 shows the isotherms of the discharge domain in the z―x plane (at y=0) of the 3-D geometry. Temperature contours clearly show that the plasma is not in axisymmetric situation, especially at the colder region of the domain. Temperature at the upper region of the lamp is higher than that of the lower region, especially around the electrodes’ends (viz. contour number 1). Due to buoyancy, hot gases flow upward. Temperature near the cathode tip is the maximum and it is above 11 000 K. Near the anode tip, temperature rises above 10 000 K. Between the electrodes, what is also known as the plasma column, the gas temperature rises to an intermediate level of about 8000 K. It can be realized that stiff temperature gradient exists just in front of the electrode tips and it is significantly stronger at the cathode end. Likewise, all other plasma properties also have very high gradient near electrodes’ tips, making the regions nonequilibrium locally. The nonequilibrium effect is, however, stronger at the cathode end.
Isocontours for velocity magnitude are shown in Fig. 5. Deviation from axisymmetric situations is clearly visible in the velocity profiles as there is no symmetry of the contour lines 1-3. The present work is done for an operating pressure at moderate level of 0.11 MPa. Commercial high pressure lamps usually operate at significantly higher pressure (more than 1 MPa). Operating pressure of ultra high-pressure lamps is around 20 MPa. Therefore, deviation from axisymmetry is more prevalent in practical lamps since buoyancy effect intensifies with pressure (or mass density) rise. The maximum velocity is calculated as more than 6 m/s near the cathode tip. Comparing to the velocity near cathode surface, it is rather lower near the anode surface. Significantly strong Lorentz forces, due to electromagnetic interactions, play an important role for such high velocities near the cathode surface. Detailed discussions are done later using the illustrations for force components of the momentum equation (see Figs.6 and 7).
Figs. 6 and 7 depict the tangential components of the Lorentz force and the force due to stress tensor. These profiles are drawn to estimate the significance of Lorentz forces in momentum equations. It is indeed true that electromagnetic interactions are small if the current magnitude is small. But even for a small current, local value of Lorentz force may be comparable with other force components of momentum equation. This may happen if the current concentrates over a small region on cathode and anode. Spot mode operation of electrode, especially cathode, is a good example for such situation. For a direct comparison, magnitude of contours in both figures is kept the same. In Fig. 6, contours beneath the contour numbers 2 and 5 at the cathode end are for the magnitudes of -105 N/m3 and 105 N/m3, respectively. Comparing these contour values with the forces due to stress tensor of Fig. 7, we can say that Lorentz forces are very strong and influential in some spatial positions. The presence of these strong Lorentz forces near the cathode surface elucidates that these forces have strong impact in causing high plasma velocity near cathode tip. Change of plasma velocity affects all other plasma properties. Therefore, Lorentz forces are significant factors in controlling plasma behavior and as a whole, lamp performance. Any discharge model that solves momentum equations would benefit if it accounts for the effects due to electromagnetic interactions (or Lorentz forces).
A light or radiation source is evaluated by its production capability of light or electromagnetic radiation. In other words, a light source’s performance is primarily judged by its radiation power per wattage output. Therefore, high efficiency or high ratio of the radiation output to the electrical input is usually sought from a light source. Numerical models of high pressure lamp are generally liable to predict the radiation output too. Although numerical investigations on radiation have been progressed significantly, still it is a challenging job to calculate this quantity accurately. Among many radiation methods, P-1 method has been found suitable for the Fluent (version 6.1) platform and is used in our model. Despite realized limitations of the method, like overestimation of radiation flux, especially, for optically thin plasma [33], it makes the trade-off by shortening the computation time and giving implication suitability for any complex geometry.
The isocontours for mean incident radiation of band 2 (119-680 nm) are shown in Figs. 8 and 9. Fig. 8 shows the contours at y = 0 of z―x plane of the domain whereas Fig. 9 is drawn at x = 11mm of y―z plane. Like temperature and velocity, incident radiation has the maximum near the cathode surface. Contours 1-4 of both figures present the deviation from axisymmetry for horizontal lamp operation. Discharge region at the bottom and electrodes’ end of the lamp does not absorb radiation and, therefore, cold but at the top, radiation is absorbed to make the region relatively hotter.
Figs. 10 and 11 present the distributions for the rate of change of volumetric Joule (or input in discharge) and radiation energies. Both energy densities are the maximum near the cathode surface. Current intensity effect on generation of radiation energy is shown in Fig.12. It presents the ratio of total radiation power to the Joule power of the plasma. Note that this Joule power is less than the total input power of the lamp because it excludes the powers expended in the near electrode regions or the sheaths. For the case of 20 A, the Joule power is calculated as 234 W whereas the radiation power is 87 W; the ratio of radiation to Joule power is 37%. The ratio increases to 45% when the lamp current is doubled. Increased current density due to the higher lamp current intensifies the volumetric Joule energy of plasma. This, in turn, raises the plasma temperature. As a consequence, the plasma becomes more conducting, the current-carrying region as well as the effective discharge region, expands. As a result, the overall radiation pronounces with current.
The presented model of this paper has been used in developing our very high-pressure lamps. Predicted electrode temperature has been seen within an accuracy of 4% and radiation power has been within 10%. We shall build a“model lamp,”having specs different from commercial lamp, in the near future for publishing the comparative theoretical and experimental results.
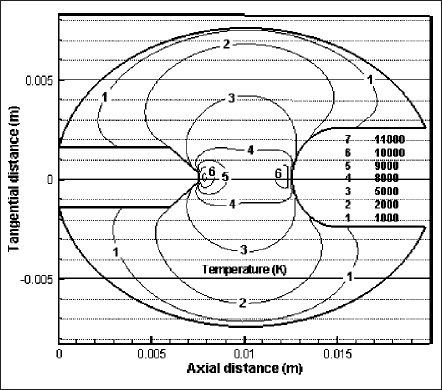
Fig. 4 Temperature isocontours in the gas-filled domain of the lamp at y = 0 of z―x plane.
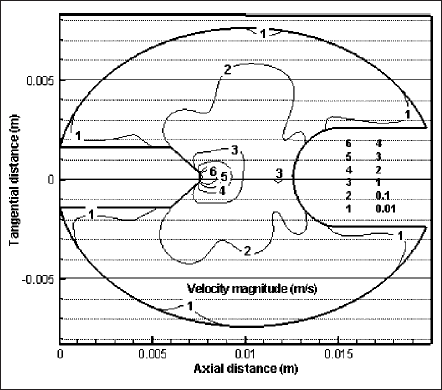
Fig. 5 Isocontours of velocity magnitude in the gas-filled domain of the lamp at y = 0 of z―x plane.
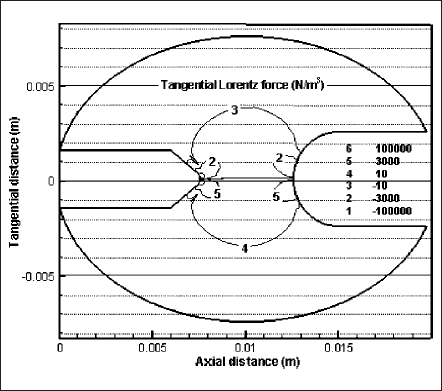
Fig. 6 Isocontours of tangential component of Lorentz forces in the gas-filled domain of the lamp at y = 0 of z―x plane.
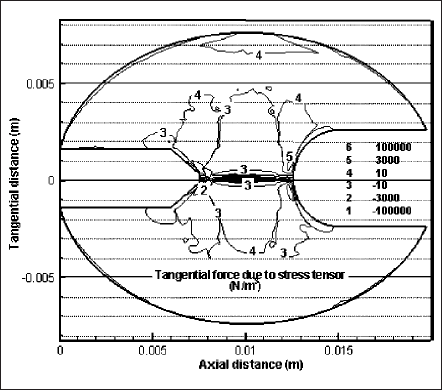
Fig. 7 Isocontours of tangential force due to stress tensor in the gas-filled domain of the lamp at y = 0 of z―x plane.
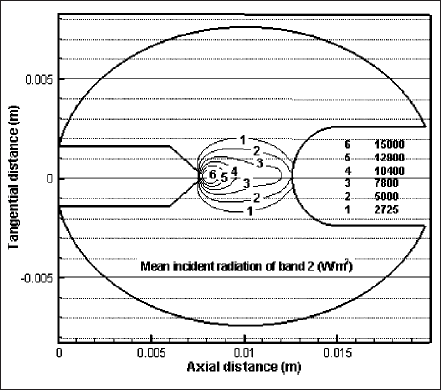
Fig. 8 Isocontours of the mean incident radiation of band 2 (119―680 nm) at y = 0 of z―x plane.
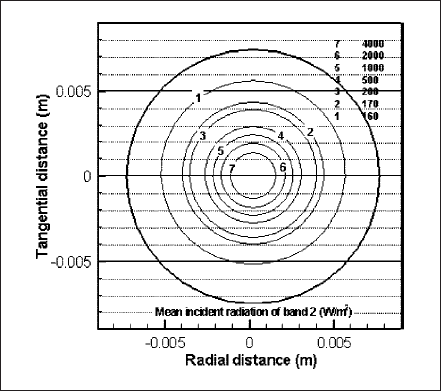
Fig. 9 Isocontours of the mean incident radiation of band 2 (119―680 nm) at x = 11 mm of zz―x plane.
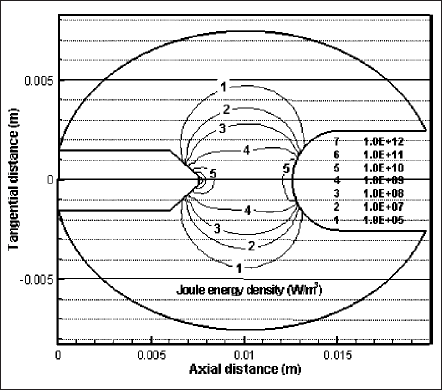
Fig. 10 Isocontours of volumetric Joule energy at y = 0 of z―x plane.
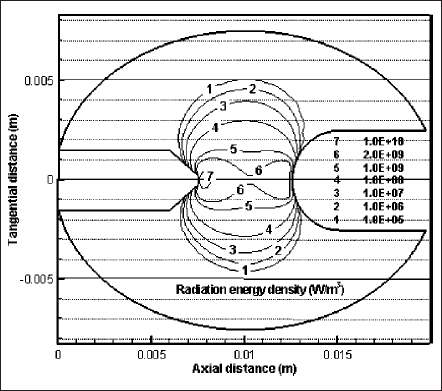
Fig. 11 Isocontours of volumetric radiation energy at y = 0 of z―x plane.
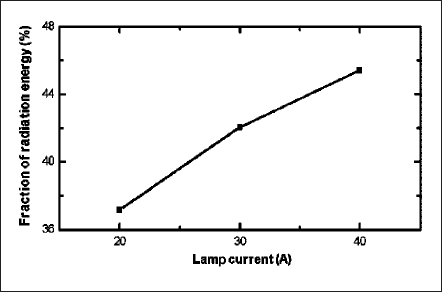
Fig. 12 Ratio of radiation energy to the input energy for different lamp currents.
V. CONCLUSION
This paper presents a self-consistent and new model that has a unique feature of 3-D implementation for the gas-filled region of high pressure lamps. The model solves the solid regions in 2-D and axisymmetric approach and the very thin cathode-sheath region in 1-D and nonequilibrium approach. Using the model, calculations have been done for a test lamp having an ellipsoid bulb-geometry and a 5-mm interelectrode gap. Discharge medium of the lamp is an Hg-Ar mixture with an operating pressure of 0.11 MPa. Radiation output of the lamp has been calculated by P-1 radiation method dividing the whole radiation spectrum into five bands.Calculated results have shown the highest temperature above 11 000 K in front of the cathode tip, around 10 000 K in front of the anode tip, and about 8000 K between electrodes. The maximum velocity has also found in front of the cathode tip and it is above 6 m/s. Results show that Lorentz forces have significant contributions in such strong velocity at the cathode surface. Therefore, inclusion of these Lorentz forces, due to the electromagnetic interactions, in the momentum equation of a plasma model is very important. Asymmetric behavior of plasma has been confirmed in the horizontally-operated lamp even with a moderate operating pressure of 0.11 MPa. Therefore, 3-D model is a prerequisite for predicting discharge properties of any HID and ultra high-pressure lamps, which operate at any orientation other than vertical. The presented model has the capability to improve lamp performance and to expedite lamp-developing cycle through parametric calculations.
ACKNOWLEDGMENT
The authors thank Prof. F. Dawson, Department of Electrical and Computer Engineering, University of Toronto, ON, Canada, for his valuable comments and suggestions in developing the 3-D plasma model.