光技術情報誌「ライトエッジ」No.22(2001年9月発行)
Water-associated surface degradation of CsLiB6 O10 crystal During harmonic generation in the ultraviolet region
Water-associated surface degradation of CsLiB6O10 crystal during harmonic generation in the ultraviolet region
Yukihiro Morimoto,a) Shintaro Miyazawa, and Yoshio Kagebayashi
Research and Development Center, Gotenba Laboratory, Ushio Inc.,1-90 Komakado, Gotenba, Shizuoka 412-0038, Japan
Naoki Kitatochi, Toshio Yokota, and Jun Sakuma
Ushio Research Institute of Technology Inc., 1-90 Komakado, Gotenba, Shizuoka 412-0038, Japan
(Received 15 September 2000; accepted 26 April 2001)
A study of the mechanisms of CsLiB6O10 (CLBO) crystal performance degradation during harmonic generation in the ultraviolet (UV) region was performed. The degradation rate of transmissivity during irradiation with the fourth harmonic light of an Nd3+ doped YLiF4 laser (4.7 eV) was linearly proportional to the concentration of hydroxyl (OH) groups in the CLBO crystal. In this study, the formation of OH groups was recognized by infrared absorption spectroscopy, and a method for determination of OH groups was proposed. The concentration of OH groups in the CLBO was linearly proportional to water vapor pressure and the CLBO containing OH groups absorbed UV light. We propose that one of the main mechanisms of surface degradation is the generation and growth of the mutants and that these mutants are generated by a UV photon-assisted reaction via OH group formation associated with absorbing water molecules into CLBO crystal.
I. INTRODUCTION
CsLiB6O10 (CLBO) crystal has excellent nonlinear optical properties and is especially employed in the fourth and the fifth harmonic generations of the Nd3+ doped Y3Al5O12 (Nd: YAG) laser in ultraviolet (UV) regions.1-3) There have been some efforts made on operating conditions to reduce the degradation of CLBO's performance, for example, conversion efficiency and themaintenance of power of fourth harmonic generation (4ω) output.3)4) It has recently been reported that the eighth harmonic (193 nm) of the output of an Er-doped fiber amplifier (1547 nm) was generated by using CLBO crystal with 7% of the conversion efficiency.5) Since more efficient conversion was desirable to generate the intense 4ω light, the bulk laser-damage threshold of CLBO crystal was investigated experimentally at a higher pulse energy. Surface finishing for the CLBO crystal by radiofrequency (rf) plasma etching was improved to prevent the surface damage.6)7) Even when the pulse energy was two or three orders of magnitude less than the damage threshold, gradual degradation of the 4ω power occurred in our laboratory. The mechanism of the degradation seemed not to be established, and was believed to be due to optical and mechanical stresses introduced by crystal hydration4) or the accumulation of the surface laser damage by the impact of high-energy (UV) laser light.
Our laboratory has empirically shown than the hydration or reactivity of CLBO with water is extreme and its optical absorption rapidly changes. Moreover, not only the UV beam spot on the exit surface of the crystal but also other paRts of the surface were mutated and whitened in color, as though the CLBO surface had been exposed to the air for a long time. We therefore tentatively hypothesized that the degradation would be associated with water vapor in the ambient atmosphere. To prove our hypothesis, we decided to investigate the relationship between the surface damage and water vapor. However, there is no existing report showing quantitative data for the solubility of water in CLBO crystal. Infrared (IR) absorption spectroscopy is a useful technique to determine water contents for crystals and glasses.8-11)
In this study, we confirmed that hydroxyl (OH) groups are formed by the reaction of CLBO with water, and established a conventional method for determining the relative concentration of OH groups in CLBO crystal, taking account of the anisotropic structure of the crystal, by means of a Fourier transform IR (FTIR) spectrometer. We will show the dependence of OH groups' concentration in CLBO crystal on water vapor pressure and/or temperature. Degradation rates during the 4ω generation by the CLBO crystals were measured to examine the dependence of surface roughness. The appearace of any degraded surface will be shown. Degradation rates of transmittance during 4ω light irradiation were measured to ascertain the surface damage under various water vapor pressures and temperatures. The relative concentration of OH groups was estimated and the changes of absorption properties in the UV region were confirmed. By combining the information obtained, we will consider and propose one of the degradation mechanisms of harmonic generation perfomance in the UV region for CLBO crystal.
II. EXPERIMENTAL PROCEDURE
All the samples used in this study were prepared from the CLBO crystal grown in our laboratory by the topseeded solution growth method. The starter solution composition was Cs2O/Li2O/B2O3=1/1/5.5 in molar ratio and the crystal growth procedure was reported elsewhere.1) Tabel I lists the 13 samples. Crystal plane, thickness, and experimental conditions are given. Each sample was optically polished and the surface roughness was confirmed to be 3 to 5 namometer (nm) of area root mean square (rms) by atomic force microscopy. Only sample B was optically polished, followed by ion beam etching, and its surface roughness was less than 1 nm of area rms.
Marathon tests evaluating output power stability of 4ω (266 nm) of the Nd: YAG laser were carried out for samples A (1=21 mm) and B (1=24 mm). The experimental setup is shown in Fig. 1 (a). During the marathon test the temperature of the samples was kept at 398 ±1K. The Nd: YAG laser was operated at a pulse frequency of 1 kHz, and the 4ω power from the samples was 0.2 W. The tests were run continuously until the 4ω power degraded to 50% of the initial state. After the tests, the output surface was inspected with a dark-field optical microscope.
To ascertain the effects of surface degradation, the thin CLBO plates of samples C, D, E, and F (thickness 2.25 mm) were irradiated with 4ω light of the Nd: YLF laser (262nm) for 100 h under wet or dry atmospheres. The experimental setup is shown in Fig. 1(b). On irradiation, the incident and the transmitted laser power were measured, and the degradation rate of transmission was evaluated. The degradation rate of transmittance, Rt(%/h), is defined by Eq. (1) as follows:
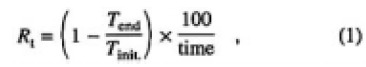
where Tinit. is transmittance at the start (time = 0), Tend is transmittance at the end (time = 100), and time is 100 h in this experiment. The laser was operated at a pulse frequency of 15 kHz with generating 4ω light of 2.0W. The power density was estimated to be 6MW/cm2, deduced from a beam spot size, whose value was at least three orders of magnitude less than the threshold energy for bulk damage to a CLBO crystal.6) During the irradiation, the samples, temperatures were measured by a K-type thermocouple and found to be 323 K for sample E and 353 K for samples C, D, and F. Water vapor pressure was settled at 3300, 1700, 880, and 63 Pa for samples C, D, E, and F. The samples were set into a cylindrical heater to control the temperature, and placed in a box with a couple of holes to transmit laser light. To maintain the water vapor pressure at 3300 Pa, a beaker filled with water was installed on a hot plate in the box. A hygrothermograph, installed in the box, measured the relative humidity and temperature from which the absolute water vapor pressure was calculated. Water vapor pressure was controlled by the temperature of the hot plate. Nitrogen gas, the dew-point temperature of which was lower than 203 K, was used to establish dry ambient air (63 Pa of water vapor) in the box, and the dew point was monitored by a dew-point hygrometer. The surface topography of the irradiated CLBO samples was examined using a dark-field optical microscope.
IR absorption spectroscopy was used to evaluate water take-up of the CLBO. An FTIR spectrometer was employed in the transmission mode to measure the absorption spectra of CLBO plates in the wave number region from 1500 to 5500cm-1 by 2cm-1 of wave number resolution. For the measurements, the incident IR beam was normal to the sample surface, and a polarizer was installed in front of the sample. Ordinary (o) and extraordinary (e) rays corresponded to linearly polarized light perpendicular to the c axis and parallel to the c axis, respectively. To avoid hydration of the samples during measurements, the spectrometer was purged by flowing dry nitrogen gas, and the measurements were carried out within 3 min of the samples being removed from the treatment situation described below. A very thin polished sample, G (thickness 0.19 mm), was left in an ambient atmosphere at 300 K and 45% relative humidity (RH) and the IR absorption spectra for o- and e-rays were measured for 200 min. To establish a method for tentatively determining the water content in a CLBO crystal, IR absorption spectra of linearly polarized light were measured for sample H from o-ray (0 degrees, parallel to a axis) to o-ray (180 degrees) in 10-degree steps. Another examination was made, anticipating the dependence of CLBO crystal on water vapor pressure for hydration to occur. Samples of different thickness, I (thickness 2.50 mm) and J thickness (3.65 mm), were heated to 457 K in a closed box where the water vapor pressure was controlled and altered between 1200 and 2400 Pa, the setup of which was the same as that described above. After each of the soaking procedures, the IR absorption spectra were measured. On heating the samples, 2400 Pa of water vapor pressure was established initially and maintained for 150 h until the IR spectra did not change in the absorption intensity. Next, the water vapor pressure was set at 1500 Pa and held for 120 h, which then held 50 h at lower pressure. Finally, samples I and J were heated at 623 K in a vacuum (1 10-4 Pa) for 70 h to eliminate the water included in the samples.
UV absorption spectra were measured with a UV spectrophotometer (Cary 45, Varian) for samples K and L (dry-CLBO), M (wet-CLBO), and C (4ω-irradiated - CLBO). Samples K (thickness 4.55 mm) and L (thickness 9.05 mm) were used to cancel the Fresnel's reflection loss and to extract the intrinsic absorption of the CLBO crystal. Sample M was left in an atmosphere of 298 K and 55% RH for 7 days. The IR spectrum was then measured to estimate the relative water contents.
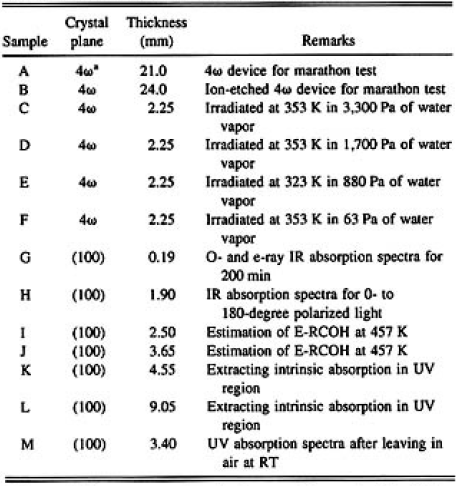
TABLE 1: List of CLBO samples used in this study
*The crystal plane was normal to the phase-matching angle of 4ω light.
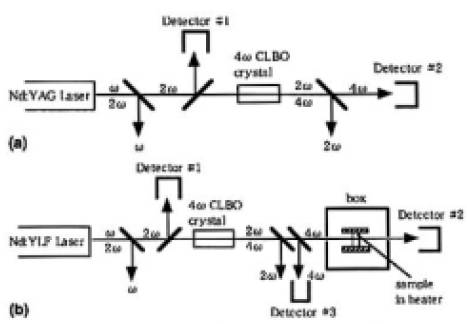
FIG. 1. Experimental setup for (a) the marathon test evaluating output power stability of 4ω (266nm) of the Nd: YAG laser and (b) recording transmission degradation rate of a thin CLBO sample by irradiation width 4ω (262 nm) of the Nd: YLF laser. The sample temperature and the water vapor pressures were controlled
III. RESULT
A. Results of the marathon tests and the irradiation experiments
In the marathon test, the 4ω power degraded to 50% at 500 h for sample A. the degradation of sample B took place very rapidly, taking only 63 h to reach half of the initial 4ω power. Sample B was treated with ion-beam etching so that the incident/exit surface was quite smooth. Figures 2(a) and 2(b) show micrographs of darkfield observation for samples A and B after the marathon tests. The 4ω beam pattern, a white, bright, oval shape consisting of numerous white dots, was observed on the exit surface for both samples. Even though CLBO has low walk-off property, the output beam patterns were oval in shape because of the long crystal lengths (21-24 mm) employed in this work. Due to light scattering, when a CLBO crystal was left in ambient atmosphere for 1 week, the surface looked white. The white oval-shaped area corresponded to this scattering surface. The exit surface of the samples was ground and optically polished again by 60 to 90µm. The oval-shaped beam mark disappeared completely, as shown in Fig. 2(c). After polishing, the initial 4ω power was regained for samples A and B. This experiment strongly suggests that the surface changes, accompanied by the formation of the beam mark, were the dominant factor in the degradation of the 4ω power generated.
The transmittance of each of the samples decreased linearly with irradiation time for 100 h, except for sample F (water vapor pressure of 63 Pa) that did not show any particular decrease. The transmittance actually increased when samples C (3300 Pa), D (1700 Pa), and E (880 Pa) were moved millimeters, indicating that the beam site of the sample surface was damaged. The degradation rate of transmittance, Rts, was plotted as a function of water vapor pressure measured for samples C, D, E, and F in Fig. 3. A linear relationship was clearly obtained for samples C, D, and F, which were heated to 353 K. However, sample E, heated to 323 K, was outside this relationship, and the Rts was higher than that of sample D. Dark-field optical microscope observations of the surfaces of these irradiated samples revealed that the most intensive beam mark was printed on sample C [Fig. 2(d)]; a little was observed on sample D, while samples E and F showed the last obvious beam mark. To summarize these experimental results, the degradation rate due to surface damage increases as the water vapor pressure increases and the crystal temperature decreases. As will be pointed out later, it is both important and practical to consider the relationship between water vapor pressure and temperature of the CLBO crystal in order to understand the degradation of 4ω output power.
X-ray-diffraction measurements were also performed for the degrade surface of CLBO a-plane plate by 266-nm light irradiation and for CLBO powder irradiated at room temperature in 3300 Pa of water vapor pressure. Any major changes in the diffraction pattern were not detected, except for the elongation of the lattice constant for a-direction in this work.
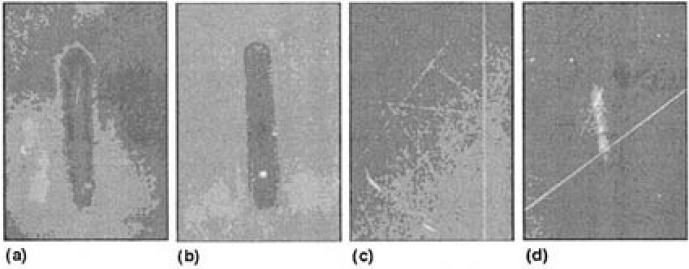
FIG.2. Micrographs of dark-field observation of 4ω beam spot, taken at x50 magnification: (a) sample A prerated for 500h at 398 ±1K in airl (b) sample B operated for 63h at 398 ±1K in air; (c) sample B reground and optically polished by 60 to 90 µm after observation of (b); and (d) sample C, irradiated for 100h at 353K in 3300 Pa of water vapor pressure.
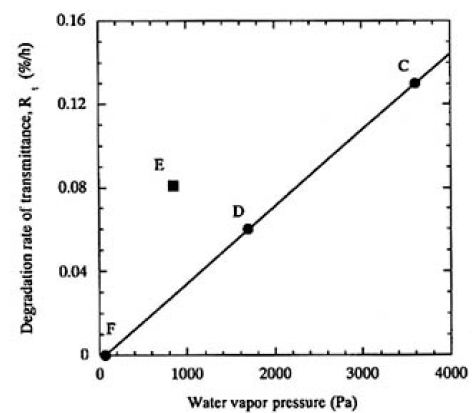
FIG.3. Plots of the degradation rate (%/h) as a function of water vapor pressure (Pa). A linear relation was clearly obtained by regression fit to data of samples C, D, and F heated to 353K.
B. IR analysis of CLBO crystal
Based on the results of the irradiation experiments, we suggest that water vapor affects the sample surface. IR absorption spectra were examined to identify the time dependence of water absorption. Figure 4 shows the recorded spectra for o- and e-rays for sample G left at 0, 60, and 200 min in an ambient atmosphere of 300 K and 45% RH. Here, the absorbency, ABS(k), was calculated by the following equation:
where k is the wave number, IBG is the detected intensity of the light source, and IS is the intensity transmitted through the CLBO samples. ABS(k) includes the reflection loss on the sample surface. The most extreme increases in the absorption intensity were recorded at the 3580 and 3410cm-1 bands for the o-ray spectrum, while the intensity changes of the 3410cm-1 band for the e-ray spectrum were slight, compared with that of o-ray spectra. As the absorption intensities were so weak in the range of 5500 to 4000cm-1, the absorbance was multiplied by 20 to show the detail of the bands. In this higher wave number region, a band at 5215cm-1 in creased for the o-ray spectrum. On the other hand, a 4150cm-1 band in addition to the 5215cm-1 band increased for the e-ray spectrum. In the less than 3000cm-1 range, where the absorptions reflect the stretching vibration of boron (B)-oxygen (O),12) the spectra were clearly resolved, and did not change during 200 min.
This feature in the lower wave number region shows that the two bands at 3580 and 3410cm-1 are not overtones of other bands, but due to fundamental absorption. Moreover, all of the bands that increased when exposed to ambient atmosphere were decreased and eventually eliminated by heating under vacuum. The literature suggests that absorption bands due to hydroxyl (OH) groups emerge at around 3500cm-1 for lithium niobate (LiNbO3) crystal,8) potassium titanate orthophosphate (KTiOPO4) crystal,9 and silica glass,11) when water molecules are dissolved into these inorganic materials. Therefore, we tentatively attributed the 3580 and 3410cm-1 absorption bands to OH groups in CLBO crystal. As discussed in Ref. 13, the differences in absorption intensity between o- and e-rays at the 3410cm-1 band could be due to the anisotropic structure of CLBO. Also, the bands at 4150 and 5215cm-1 are induced by water vapor and the molar extinction coefficients of these two bands are less than one twentieth. We refer to the bands at 3410 and 3580cm-1 as α- and β-OH bands and to the bands at 4150 and 5215cm-1 as γ- and δ-OHrelated bands for CLBO crystal in this article.
Figure 5 shows the absorption spectra of α and β-OH bands measured for sample H from o-ray (0 degrees, parallel to a axis) to e-ray (90 degrees, parallel to c axis). Only the spectra from 0 to 90 degrees were shown, because those measured from 90 to 180 degrees were almost identical. To obtain the relative concentration of OH groups, the absorption spectra should be measured for polarized light from 0 to 180 degrees and compared with those of other samples. With reference to the difficulty of this procedure, we found the following relationship from complementary experiments:
Here, x denotes the time for the sample left in ambient atmosphere, and ABSv.h.(k) is the absorbance of the sample heated in a vacuum. Therefore, the relative concentration of OH groups in CLBO can be expressed by using only the measured o-ray absorption spectrum. The α and β-OH bands are useful for determining the low relative concentration of OH groups. However, as seen from Figs. 4 and 5, these bands will be saturated and cannot be used for determination in the case of thicker CLBO samples and/or higher OH concentration. In such cases, the δ-OH related bands in available, because the extinction coefficient of the band is more than one order of magnitude lower than that of the α- and β-OH bands. In addition, there is no absorption due to B-O vibration in the location of the δ-OH related band. Figure 6 shows the plots of increased area of the δ-O-related band as a function of those of the α- and β-OH bands measured for samples G and H, left in air after heating in a vacuum. The regression fit to data produced on straight line almost through the origin with a slope of 1/129. Based on these experimental results, the relative concentrations of OH groups (RCOH, in cm-2) were defined and calculated using the area of α-, β- and δ-OH bands measured for o-ray:
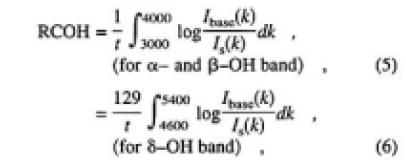
where t is the thickness in centimeters, and Ibase is the detected light intensity through the sample after heating in a vacuum. RCOH does not include the reflection loss and sum of the absorption coefficient in the integral regions. Also, RCOH is the average value in the sample, which does not take into account the distribution of OH group concentration.
Samples I and J were heated to 457K at a certain water vapor pressure from 1200 to 2400 pa until the IR spectra were not changed by further heating. This statement was established because of the equilibrium between water vapor in the box and CLBO samples and homogeneity in the concentration distribution. Therefore, of samples I and J, the relative concentration of OH groups in equilibrium (E-RCOH) was obtained by;
Figure 7 shows the plots of the obtained E-RCOHs as a function of water vapor pressures measured. The straight line was obtained by regression fit, which shows that the OH groups are formed by the first-order reaction of CLBO with water molecules. This dependence of the solubility of water molecules in CLBO on water vapor pressure coincided with the degradation rate of transmittance at the same temperature.
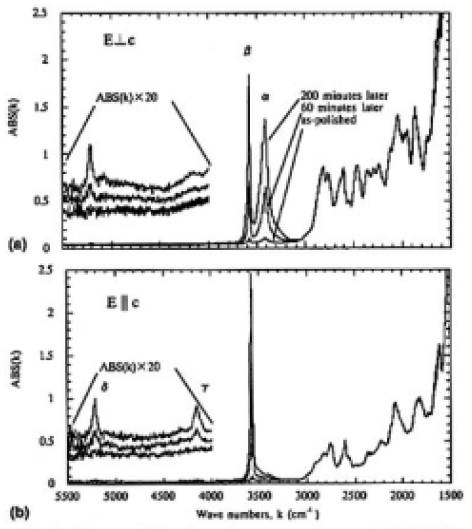
FIG.4. Changes of IR absorption spectra for sample G left for 0, 60, and 200 min in an ambient atmosphere (300 K and 45% RH); (a) o-ray and (b) e-ray. The thickness of the sample was 0.19mm. The baselines were shifted higher in the range from 5500 to 4000 cm-1.
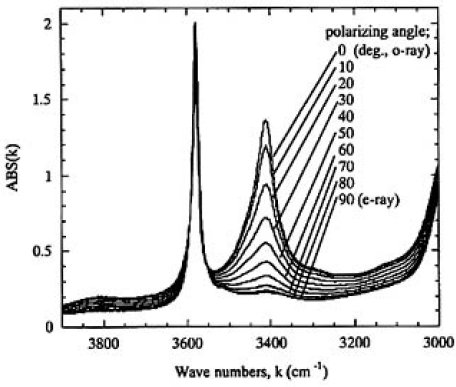
FIG.5. O-ray absorption spectra of α- and β;-OH bands measured for sample H (thickness 1.9mm) from o-ray (0 degrees) to e-ray (90 degrees).
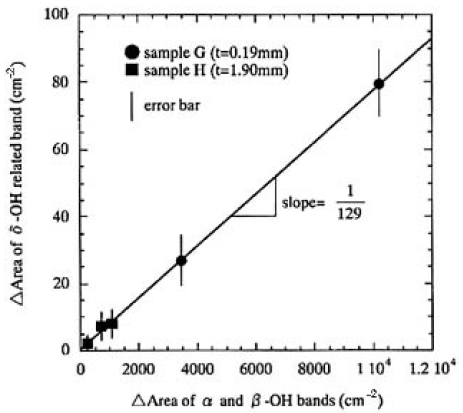
FIG.6. Plots of increased area of the δ-OH-related band as a function of those of the α- and β;-OH bands measured for samples G and H left in air after heating in a vacuum. The regression fit to data produced on straight line almost through the origin with a slope of 1/129.
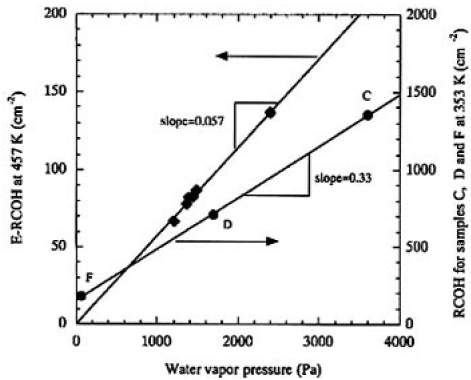
FIG.7. Plots of the obtained E-RCOHs from samples I and J at 457K as a function of water vapor pressures maintained. Circle plots are for samples C, D and F irradiated at 353K. The straight line is the result of regression fit to data.
C. Changes of optical absorption properties in the UV region by water absorption
The o-ray absorption spectra of samples K (thickness 4.55 mm) and L (thickness 9.05 mm) are shown in Fig. 8(a). Here the error of measurement was estimated to be ±1 x 10⁻³ of absorbance. Assuming the surface conditions were identical, the differences resulted from the intrinsic absorption of the CLBO crystal. The differences can be seen in the more than 6.7-eV range, and in our samples, measured at room temperature, there was no absorption in the less than 6.6-eV (188-nm) region.
However, as the extreme case for CLBO's absorption water by exposing in ambient atmosphere for 7 days at room temperature and as shown in Fig. 8(b), the absorption was increased for sample M. Fig. 8(c) also shows the changes of absorption spectra for sample C before and after irradiation at 353 K, and it was found that for both samples C and M, the continuum absorption bands were induced in the whole of the range of the measured UV region, including the wavelength of 4ω light. The RCOH of samples C and M were estimated to be 1350 and 5950cm-2 by using the δ-OH-related band, respectively These results suggest that the absorption intensities underwent extreme change near the absorption edge and were increased by forming OH groups in the CLBO crystal and whose tendency was enhanced by 4ω light irradiation.
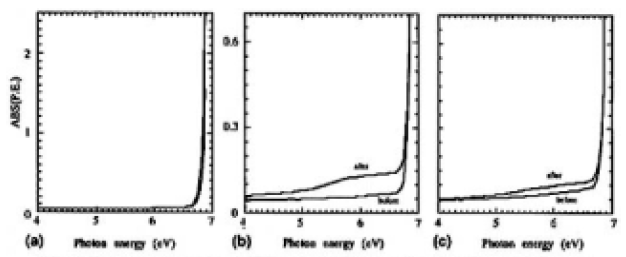
FIG.8. UV absorption spectra of (a) samples K (4.55mm) and L (9.05mm) for o-rays, (b) sample M before and after being exposed to ambient atmosphere for 7days, and (c) sample C before and after irradiation.
IV. DISCUSSION
The decrease of 4ω power and transmittance resulted from the water-associated degradation of the surface region, i.e.,“surface damage.”The hypothesis we made, that the degradation would be associated with water vapor, was investigated qualitatively; i.e., the proportational change of surface degradation took place as a function of water vapor pressure at the same crystal temperature. In this study, the degradation rate of the CLBO sample etched by ion beam was almost 10 times faster than that of the sample treated by less quality polishing, although Kamimura et al. reported that the surface lifetime prolonged by ion etching an output surface of a CLBO device.7) The reason for this discrepancy observed in this work is presently unknown. However, the degradation was enhanced, even in lower humidity atmosphere, when the crystal temperature was lower. One of the mechanisms for the water-associated degradation is considered briefly in this section.
The important physical and/or chemical property that we found in this study was that the E-RCOH changed proportionally to water vapor pressure, as shown in Fig. 7. The degradation rates of transmittance were plotted as a function of RCOH for samples C, D, E, and F, as shown in Fig. 9. In this manner, a linear relationship was obtained for all the irradiated samples and it was found that the degradation rate was linearly proportional to the RCOH of the CLBO crystal. We finally concluded that the degradation depends upon the surface damages, which, in turn, depends upon the concentration of OH groups in the CLBO crystal. In Fig. 9, the line of regression fit hits about 150cm-2 of RCOH at which the degradation rate of transmittance is equal to zero. This might imply that there is an upper limit of OH group concentration for no degradation taking place. The Rt for sample E was 1.3 times faster than that for sample D, even if the water vapor pressure was maintained at half that for sample D. This was because the amount of OH contained was 1.25 times higher than that of sample D. The most likely reason sample E absorbed much more water than sample D may be due to the CLBO's property of solubility of water. The RCOHs for samples C, D, and F (at 353 K, Fig. 9) are plotted against water vapor pressure(Fig. 3) and shown in Fig. 7 to compare with the plot obtained for 457 K. Even though the RCOH for samples C, D, and F irradiated with heating at 353 K was not reached maximum, the slope was more than five times greater than that at 457 K, as shown in Fig. 7. The solubility of water in CLBO, which is a function of temperature and water vapor pressure, is lowered exponentially by not only heating at high temperature, but also set in lower water vapor pressure condition. This is a more quantitative expression for the reported evidence that heating is an effective way to prevent CLBO crystal hydration.4)
However, the degradation was not thought to occur just by exposure to water and formation of OH groups in CLBO since the transmittance of 4ω light increased when the irradiated spot was moved to the side in the irradiation experiment. Gaseous water does not seem to be the direct cause either because the water molecule itself does not absorb and is not excited with 4.7 eV of 4ω light.14)15) To investigate the role of 4ω light, UV absorption spectra were analyzed and the difference spectra shown if Fig. 8 were calculated. Figure 10(a) shows the obtained absorption coefficient of the CLBO sample. Apparently, there was no opportunity to absorb 4 ω light (4.7 eV) by the dry CLBO crystal by one photon process. The difference spectra for the wet and the irradiated CLBO samples were completely different from that of the dry CLBO, as shown in Fig. 10(b). A broad absorption band at 6.0 eV was induced in both the wet and the irradiated CLBO samples. Since this band absorbs 4.7eV light at its tail and the absorption coefficient is about 5 x 10⁻²cm-1, there is some opportunity for the wet CLBO to absorb 4.7-eV light and to be excited. In fact, although the RCOH of sample C (353 K in 330 Pa) was 1350cm-2, which was less than one-fourth of 5950cm-2 of sample M, the intensity of the induced band at 6 eV for sample C was 0.12cm-1 by irradiation for 100 h and which was just about half of 0.21cm-2 of sample M by 7 days exposure in air, as shown in Fig. 10. Therefore, the degradation phenomena was dominated by photo-assisted reaction.
Based on these considerations, we would like to propose here that one of the main mechanisms of the surface degradation phenomenon is mutant production, expressed by the following reaction equations:
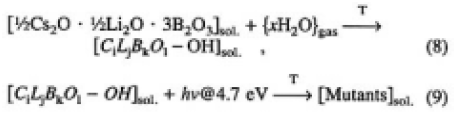
Equations (8) and (9) represent the mutant as the product of photoassisted reaction on the surface, taking place in the presence of CLBO, water and 4.7-eV light. After the OH groups are formed by water absorption in the CLBO crystal, the OH groups absorb and will be excited with 4.7-eV light, and the mutants of CLBO are produced. The composition of the mutant of CLBO, or the molar fractions of the components in this equation, are unknown. According to this study, describing the degradation phenomenon as photo-assisted generation of mutants in the surface region of CLBO is more precise than the term surface damage widely used so far.7) The CLBO mutant must have completely different characteristics from CLBO crystal with respect to optical properties, such as the absorption edge, transmissibility at 266 nm as shown in Fig. 10, and 4ω generation efficiency. The most favorable way to prevent generation mutants and to obtain strong and stable 4ω output is to use CLBO in a dry condition, in other words, eliminating water from Eq. (8).
Because we did not investigate the electric excited states of OH groups in CLBO crystal, we could not use the term photochemical reaction, and therefore, we use the expression photoassisted reaction. Nor did we determine the mutant induced on the CLBO's surface. This still remains to be investigated.
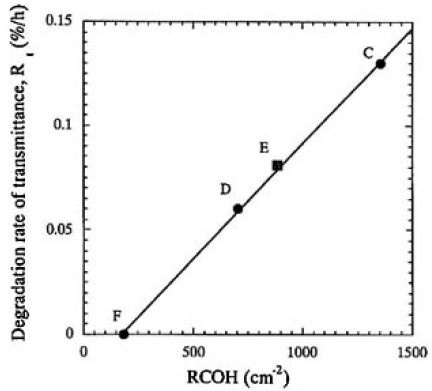
FIG.9. Relationship between the degration rates of transmittance and RCOH for samples C, D, E and F. A linear relationship was obtained by regression fit for all the icradiated samples.
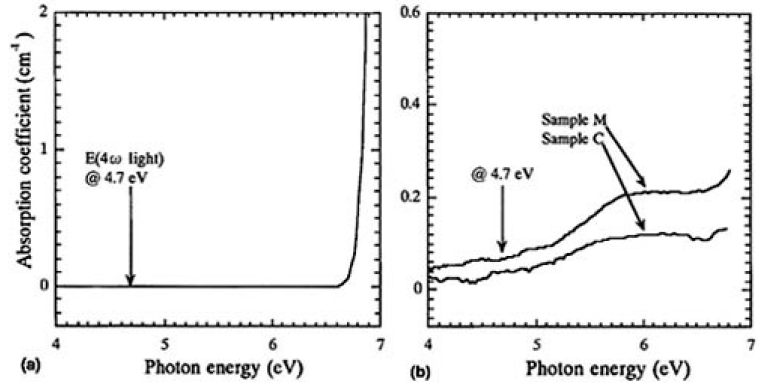
FIG.10. (a) Difference spectrum of samples K (4.55mm) and L (9.05mm), and (b) the difference spectra obtained by subtracting the spectrum, before exposing (sample M) or irradiating (sample C), from that after the treatments.
V. SUMMARY
We investigated surface degradation mechanisms experimentally and found that one of the main mechanisms of degradation was the photoassisted generation of mutants in the surface region of CLBO crystal. Investigation of the reaction steps leading to mutant generation revealed the following.
- (1) OH groups were formed in CLBO crystal when CLBO absorbed water molecules. The OH groups in CLBO crystal are detected at 3410 and 3580cm-1 as α- and β-OH bands and at 4150 and 5215cm-1 as γ- and δ- OH-related bands in the IR absorption spectrum.
- (2) After forming OH groups, CLBO crystal absorbed UV photons of more than 4.5 eV.
- (3) The degradation rate of 4ω light transmission was linearly proportional to the concentration of OH groups in CLBO crystal. Surface degradation was due to production of CLBO mutants.
- (4) The mutants are produced by excitation of OH groups in CLBO crystal with 4.7 eV light.
The performance of 4ω output form the CLBO crystal can be effectively prolonged by maintaining the relative concentration of OH groups below 200cm-2.
ACKNOWLEDGMENTS
The authors thank Dr. K. Deki, Japan Atomic Energy Research Institute, Dr. Y. Osako, Erectro Scientific Industry Inc., and Mr. M. Horiguchi, Ushio Research Institute of Technology Inc., for fruitful discussions. The authors express appreciation for the assistance of Ms. S. Yamada, Mr. M. Suzuki, Mr. Shioya, and Mr. M. Ino, Ushio Inc., for sample preparation and laser operation.