Journal of Physics D:Applied Physics 37号(2004年)
A study of radial cataphoresis and ion densities
in high power density Hg-Ar discharges
Y Aiura and J E Lawler
Department of Physics, University of Wisconsin, 1150 University Avenue, Madison,WI 53706, USA
Received 28 June 2004, in final form 27 August 2004Published 28 October 2004
Online at stacks. iop. org/JPhysD/37/3093
doi : 10. 1088/0022-3727/37/22/006
Abstract
A synchrotron radiation absorption experiment was used to measure the absolute density of ground level Hg atoms and Hg+ ions in Hg-Ar discharge plasmas at high power densities. Ion densities from this experiment were tested using microwave interferometry and compared with Langmuir probe measurements of the electron density. Radial cataphoresis was observed in this experiment and compared with model predictions. The agreement was satisfactory between the experiment and model. The role of cataphoresis in the power balance of Hg-Ar plasmas was further explored in the research described in the companion paper (Lister et al. 2004 J. Phys. D: Appl.Phys. 37: 3099-3106).
(Some figures in this article are in colour only in the electronic version)
1. Introduction
New types of fluorescent lamps, including both compact and electrodeless lamps, utilize Hg-rare gas discharges at much higher power densities than standard fluorescent lamps. Several plasma physics phenomena, which are relatively unimportant in the plasma of standard fluorescent lamps, become important in high power density Hg-rare gas discharges. Numerical models are playing an increasingly important role in the further development of fluorescent lamp technology (e.g. Waymouth and Bitter (1956), Cayless (1963), Winkler et al (1983), Dakin (1986), Kreher and Stern (1988), Kreher and Stern (1989), Maya and Lagushenko (1989), Lister and Coe (1993), Zissis et al (1992)). Plasma models, which have been optimized under standard fluorescent lamp conditions, have not yielded agreement with experiments for high power density Hg-Ar discharges (Curry et al 2002).
Radial cataphoresis, electron-ion scattering, ladder like ionization and deviations from the fundamental spatial mode for both ambipolar diffusion and radiation transport are some of the plasma phenomena that become important at high power densities. Radial cataphoresis refers to the preferential ionization of a component with a low ionization potential in a multi-component discharge, followed by the expulsion of this component via ambipolar diffusion. The diffusion coefficient for neutral atoms returning to the centre of a glow discharge scales with the gas temperature, and it is always much smaller than the ambipolar diffusion coefficient, which is proportional to the electron temperature. Radial cataphoresis is very important in low pressure Narare gas discharges (Van Tongeren 1975) and Cs-rare gas discharges (Bleekrode and van der Laarse 1969). Although this phenomenon is thought to be well understood, its full impact on an Hg-rare gas plasma may be quite complex. Radial cataphoresis may ultimately result in excitation of higher order spatial modes for ambipolar diffusion of electron-ion pairs, and resonance radiation transport. Radial cataphoresis can even change the colour of a light source under extreme conditions (Bakker et al 2000).
In this study the high sensitivity absorption spectroscopy (HSAS) facility of the white light (WL) beamline at the Synchrotron Radiation Center in Stoughton, WI was used to measure densities of ground level Hg atoms and Hg+ ions in an Osram Sylvania Icetron® lamp (Godyak and Shaffer 1998). The Icetron lamp is a high power density, electrodeless fluorescent lamp. Standard T12 fluorescent lamps operate with 6 mTorr of Hg and ~3 Torr of Ar in a discharge tube of 36 mm inner diameter (ID) at 400 mA current. Icetron lamps operate with a similar Hg pressure, but have a much lower Kr or Ar pressure of 300 mTorr, a somewhat larger ID of 48 mm and currents of up to 6 A. Icetron discharges operate at current densities nearly an order of magnitude higher than standard fluorescent lamps. Inductively coupled Icetron lamps are also different in that they operate at 250 kHz instead of the 60 or 50 Hz line frequency of standard electroded lamps.
Spatial maps of the absolute density of ground level Hg atoms from this experiment have a dip on axis. This dip is a clear manifestation of radial cataphoresis. Spatial maps of the absolute density of Hg+ ions are in reasonable agreement with a fundamental mode solution of the ambipolar diffusion equation. Ion densities from this experiment were tested using microwave interferometry and compared with previously published Langmuir probe measurements of electron density (Godyak et al 2001). Ion density maps and experimental cold spot temperatures from this experiment were used in a simple diffusion model to predict the Hg atom density profile and degree of radial cataphoresis. Agreement is satisfactory between the experimental Hg density maps and model predictions.
2. Experiment
Figure 1 is a schematic of the custom Icetron lamp used in our experiments. The geometry of this custom lamp is similar to that of production Icetron lamps except that it has no phosphor and is made of fused silica. The custom lamp was filled with 300 mTorr Ar. A key difference for our experiment was the addition of high quality Suprasil® windows at each end of one arm of this racetrack lamp. Ferrite cores around the short connecting arms at each end of the lamp were used to couple 250 kHz RF power into the plasma. It is convenient to think of this system as a transformer with a single loop secondary formed by the plasma. A Rogowski coil was used to monitor the lamp current, and a single loop of wire in parallel with the discharge was used to monitor the lamp voltage.
The temperature of a small ‘cold spot’ appendage was controlled the rmoelectrically to stabilize the Hg pressure at the wall. The entire lamp was enclosed in a temperature- stabilized oven to ensure that the appendage served as the cold spot. This oven was constantly flushed with dry nitrogen so that radiation at wavelengths λ < 200 nm was not absorbed by the oxygen in the laboratory air. This nitrogen flushing had an additional benefit in that it limited ozone production by the lamp.
The HSAS facility at the Synchrotron Radiation Center in Stoughton, WI was used for these experiments. Many earlier experiments with the HSAS facility were on low pressure, hollow cathode discharge plasmas. The HSAS facility has been described in detail elsewhere (Lawler et al 1999), but the key features are summarized here. Figure 2 shows the layout. Continuum radiation is produced by a 2.083 m radius bending magnet at the WL beamline on the Aladdin storage ring. This ring is typically operated with 250 mA of electron current at 800 MeV, which provides a bright, stable and spectrally smooth continuum across the infrared (IR), visible, ultraviolet (UV) and soft x-ray regions. The WL beamline consists of vacuum couplings and a gold coated grazing incidence concave mirror that re-images the synchrotron radiation. Soft x-rays from this beamline are absorbed in a sapphire window during our experiment. The synchrotron radiation spectrum transmitted by the window is smooth and slowly varying from the IR transmission limit of sapphire, near λ=6.5µm, to the UV transmission limit, near λ=150 nm. The synchrotron radiation power per unit frequency interval from a bending magnet varies as the 1/3 power of the frequency for these lower frequencies (e.g. Jackson 1999). The experimental lamp is mounted at the 0.2 mm (vert.)×0.8 mm (horiz.) focus of the synchrotron radiation beam produced by the gold coated grazing incidence mirror. The divergence of the radiation beam is approximately 24 mrad (vert.)×10 mrad (horiz.).
The spectrometer/detector system is a 3 m focal length, vacuum-compatible spectrometer equipped with a 300 line mm-1 echelle grating blazed at 63º. A 0.2 m focal length Seya monochromator acts as an order sorter and reduces the amount of scattered light in the 3 m spectrometer. The detector, mounted at the exit of the 3 m spectrometer, is a Princeton Instruments CCD camera. By binning vertical pixels together, we record a CCD spectrum in one-dimensional spectroscopic mode. The 3 m spectrometer, equipped with a CCD array and order sorter, has a practical resolving power of 350 000. This high spectral resolving power greatly simplifies data analysis. The HSAS facility was originally developed and used to measure oscillator strengths (ƒ-values) of vacuum UV (VUV) resonance transitions of singly charged iron group ions to support Space Astronomy with the Hubble Telescope (e.g. Bergeson et al (1996), Mullman et al (1997), Mullman et al (1998), Fedchak et al (2000), Wiese et al (2001)).
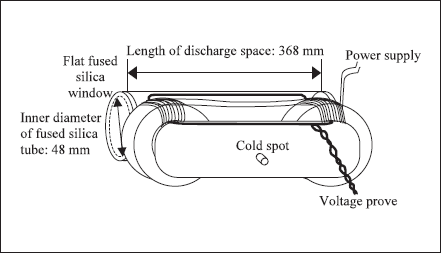
Figure 1. Drawing of the custom Icetron lamp.
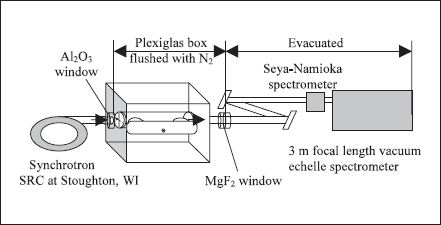
Figure 2. Schematic of the HSAS facility and experiment on the Icetron lamp.
The choice of the best absorption lines is important. Although it might appear easier to perform the Hg density measurements using the 61 S0-63 P1 resonance line at λ=254 nm, this is not the best line. The best Hg line is the 61 S0-61 P1 resonance at λ=185 nm. Although both resonance lines of Hg are optically thick at the line centre, the stronger 185 nm line is much thicker. Under our experimental conditions the 254 nm absorption signals are on the nearly flat ‘Doppler dominated’ part of the curve-of-growth. The curve-of-growth is the relationship between the equivalent width, or area of the absorption signal in a transmission plot, and the column density of atoms or ions (Thorne et al 1999). The 185 nm absorption signals are on a part of the curve-of-growth dominated by the Lorentzian wings of the line profile. In this region the equivalent width is proportional to the square root of the column density. On log-log plots of the curve-of-growth this region is often called the ‘second linear region’. In order to have good sensitivity to changes in column density, it is important to use a part of the curve-of-growth that is not flat. The best Hg+ line is the 62 S1/2 -62 P1/2 resonance at λ=194 nm.
The curves-of-growth used in the analysis of the Hg 185 nmabsorption data and Hg+ 194 nmdata were calculated to be as realistic as possible. These curves-ofgrowth were based on the best available absorption oscillator strengths (ƒ-values), complete hyperfine and isotopic structure, and full Voigt profiles for each component including Doppler, radiative and collisional broadening. The Hg 185 nm absorption ƒ-value of 1.04±0.06 measured by Bousquet and Bras (1980) was used in this work. Numerous earlier measurements were reviewed by Menningen and Lawler (2000), but they found that the most recent ƒ-value measurement from Bousquet and Bras gave the best agreement with their experimental radiation trapping data. Earlier measurements of this ƒ-value were somewhat (4-13%) larger than 1.04. Although any ƒ-value larger than unity appears to violate the ƒ-value sum rule, it can be explained easily by more than one electron participating in the transition, e.g. core polarization effects. The Hg+ 194 nm absorption ƒ-value of 0.17 selected for this research is an average of the 0.15 experimental ƒ-value from Bruneteau et al (1974), the 0.17 theoretical ƒ-value from Migdalek and Baylis (1979) and the 0.191 theoretical ƒ-value from Brage et al (1999). The estimated uncertainty of this ƒ-value is ±10%. Wamsley et al (1990) used 0.16 during earlier absorption work on Hg+, before the new calculation by Brage et al (1999) was available. The hyperfine and isotopic structure of the Hg 185 nm line is well known (LeBoucher et al 1974, Gerstenkorn et al 1977) and was included in our curveof- growth calculation. The hyperfine and isotopic structure of the Hg+ 194 nm line from Guern et al (1977) was used. Separate Voigt profiles were included for all components of the 185 and 194 nm lines in our curves-ofgrowth. The Lorentzian contribution to the Voigt profile completely dominates the Hg 185 nm curve-of-growth in the region of interest, while the Doppler contribution to the Voigt profile is more important for the Hg+ 194 nm curve-of-growth in the region of interest. The Lorentzian width of the Hg 185 nm line, 0.0039 cm-1, was primarily from radiative broadening, 0.0036 cm-1, due to the short 1.48 ns lifetime of the 61 P1 level. Resonance collisional broadening from the collision of 61 P1 Hg atoms with ground level Hg atoms was included in the Lorentzian width using the standard formula (Corney 1977). Buffer gas broadening from the collision of 61 P1 Hg atoms with ground level Ar atoms was included using the broadening coefficient from Bousquet and Bras (1977). An estimated Lorentzian width of 0.002 cm-1 and a Doppler width corresponding to a temperature of 350 K were used for the Hg+ 194 nm line. Although the gas temperature varies with current density in the lamp, the Doppler width is proportional to the square root of the absolute temperature. A 70 K or 20% change in absolute temperature produces a 10% change in Doppler width.
In earlier experiments with the HSAS facility, and in the research described here, absorption spectra were processed using a digital subtraction technique described by Wamsley et al (1993). In order to remove the contribution of the experimental lamp emission from the absorption spectra, the CCD was used to record an emission spectrum from the experimental lamp with the synchrotron beam blocked, which was then subtracted pixel-by-pixel from an absorption spectrum recorded with the synchrotron beam unblocked. The absorption spectrum, with experimental lamp emission removed, was normalized (divided) pixel-by-pixel using a dark-signal-corrected continuum spectrum recorded with the experimental lamp turned off. This digital subtraction and normalization of spectra corrects for experimental lamp emission and for pixel-to-pixel variations in the CCD sensitivity and dark signal. The method also removes fringes from optical components and other non-random noise. Good signal-to-noise (S/N) ratios have been achieved using this method at wavelengths down to 140 nm (Fedchak et al 2000).
This standard approach for processing the HSAS data worked well for the Hg+ 194 nm line, but it had to be modified for the Hg 185 nm line. The column density of Hg atoms remained large even when the discharge in the experimental lamp was extinguished. It was quite difficult and time consuming to remove enough Hg from the path to make the lamp transparent at 185 nm by cooling the lamp. The dark-signal-corrected continuum spectra for normalizing pixel-to-pixel variations in the CCD and other effects were recorded by tuning the spectrometer to 186 nm. This resulted in less than perfect cancellation of pixel-to-pixel variations and ‘fringes’ from interference of radiation in optical components. The absorption signals at 185 nm were so large that this additional noise in the data was not a serious problem.
During the operation of an HSAS experiment on an arc or glow discharge plasma, it is important to verify that the synchrotron radiation does not perturb the plasma. This was verified by attenuating the synchrotron radiation and confirming that the absorption signals were unchanged. All HSAS spectra in this work were corrected for leakage or scattered radiation in the spectrometer. This correction was determined using a small cell containing liquid Hg, but otherwise evacuated. This cell, when heated to ~400 K in the optical path, becomes so thick atλ=185 nm line that the bottom of the absorption profile is flat. The residual signal with a flat bottomed absorption profile provided a direct measure of the scattered radiation in the spectrometer. The scattered radiation correction at 194 nm was smaller than the correctionat 185 nm, and it was determined from a study of the absorption signal as a function of spectrometer slit width.
3. Theoretical model of radial cataphoresis
The basic equation, which describes radial cataphoresis, is the equation of continuity for the Hg elemental density,
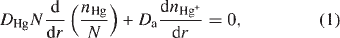
where DHg is the diffusion coefficient of Hg atoms through the Ar buffer gas, N is the buffer gas density, nHg is the density of Hg atoms, Da is the ambipolar diffusion coefficient and nHg+ is the density of Hg+ ions. The first term of this equation is written in a fashion that clarifies that some of the reduction in the central density of Hg atoms was due to gas heating. This effect was neglected in the initial analysis of absorption data from our experiment, but was included in the more detailed modelling described in the companion paper (Lister et al 2004). A cold spot temperature of 323 K was maintained for most of the experimental results reported herein. A constant discharge gas temperature Tg=350 K and a constant electron temperature Te=11 600 K were used in the initial analysis of this data. For consistency with the companion paper, the coefficient for Hg atoms diffusing through Ar was taken from Lister and Coe (1993); this coefficient was originally computed by Cayless (1961) using the methods of Hirschfelder et al (1954). The ion mobility in the ambipolar diffusion coefficient was taken from Chanin and Biondi (1957). The coefficients are
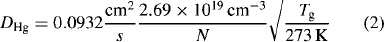
and
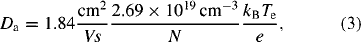
where kB is Boltzmann’s constant and e is a unit charge. In order to solve equation (1) precisely it is necessary to couple this equation into a more complete discharge model as was done in the companion paper (Lister et al 2004). However, a first order analysis can be performed by assuming that the radial distribution of Hg+ ions is described by the lowest spatial mode for ambipolar diffusion. This approximation yields
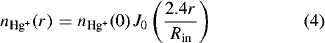
and
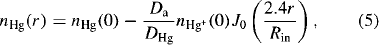
where J0 is a zero order Bessel function Rin is the inner radius of the discharge tube. This simple solution clarifies the essential physics: specifically the radial cataphoresis is significant any time the fractional ionization of Hg is comparable with DHg/Da or Tg/Te•. If the fractional ionization of Hg actually approaches DHg/Da, then the higher order diffusion modes become important in both the ambipolar transport of electron-ion pairs and in the return diffusion of Hg atoms. This occurs because the ionization rate per unit volume cannot mimic the J0 radial distribution of electrons once the density of Hg atoms is depleted on axis. At some point with severe radial cataphoresis the buffer gas starts to become excited and ionized, because nHg (r)cannot become negative. Severe radial cataphoresis with electrodeless operation often extinguishes the discharge since it disrupts the RF circuit match. However, a robust high power RF source can be used to change the colour of a Hg-Ne discharge as demonstrated by Bakker et al (2000).
4. Experimental results and comparison to model
Figures 3 and 4 are, respectively, sample plots of Hg 185 nm and Hg+ 194 nm absorption data. The S/N ratio of the Hg 185 nm data is worse than typical data from the HSAS facility because the dark-signal-corrected continuum spectrum, which was used to divide out pixel-topixel variations and fringes from optical components, had to be recorded at 186 nm. This made the division much less effective in reducing noise from various sources.
Figures 5(a) and (b) are, respectively, plots of the Hg+ density as a function of the offset from the axis in the horizontal (a) and vertical (b) planes at discharge rms currents of 3, 4.5, 6, and 7.7 A with a 323 K (50ºC) cold spot temperature. The ordinate of the plots is given as an absolute density or (columndensity)/(length of plasma). The plasma length of 320 mm has not been corrected for fringing of the plasma near the bends at each end. A least-square fit to a zero order Bessel function is superposed on each plot. Some slight asymmetry due to the discharge‘hugging’the inner wall of the toroidal discharge tube is visible in some of the plots.
Figure 6 is a plot of the axial Hg+ density as a function of rms current with a 323 K cold spot. The uncertainty in the absolute scale of the Hg+ plot should not be significantly worse than the uncertainty in the Hg+ ƒ-value or ±10%.
Although individual column density measurements have larger uncertainty or experimental scatter, these axial densities of figure 6 are from the least-square fits to all column density measurements at each current.
The result at 6.0 A in figure 6 was checked using a 70 GHz microwave interferometer. An electron column density of 9.64 ×1012 cm-2 was measured at 6.0 A across one arm of the discharge tube using the microwave interferometer. In order to compare this ‘cross tube’electron column density with the result for 6.0 A in figure 6, a radial distribution must be assumed. The equation
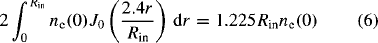
provides the relation between the electron column density (lhs) and peak axial electron density, ne (0), using the assumption of a zero order Bessel function for the radial distribution. This equation yields an axial electron density of 3.28 × 1012 cm-3 from the measured electron column density, which is in good agreement with the axial Hg+ ion density in figure 6. A significantly lower value of 1.9 ×1012 cm-3 for the same parameters was measured in Langmuir probe experiments by Godyak et al (2001). This discordance is in line with other experimental and theoretical observations and is discussed in more detail in the companion paper (Lister et al 2004). Absolute probe measurements are usually much easier to perform than the spectroscopic absolute density measurements reported herein, but probe measurements are often significantly more difficult to interpret. The electron temperature measurements from Godyak et al (2001) are thought to be quite accurate as discussed in the companion paper.
Figures 7(a ) and (b ) are, respectively, plots of the Hg density as a function of offset from the axis in the horizontal (a ) and vertical (b ) planes at discharge rms currents of 3, 4.5, 6, and 7.7 A with a 323 K (50ºC) cold spot temperature. The Hg column densities were converted to absolute densities using the 368 mm length between the inner surfaces of the Suprasil windows. The theoretical Hg densities indicated by the curved lines in the plots are from equation (5), the first order analysis of radial cataphoresis. It is important to note that there are no adjustable parameters in the theoretical plots, since the axial Hg+ densities, nHg+ (0), used in equation (5) are experimental and the Hg wall density, nHg(Rin), is from the cold spot temperature. All the experimental results show evidence of a ‘hollow’ Hgdensity profile, and all are in reasonable agreement with the model.
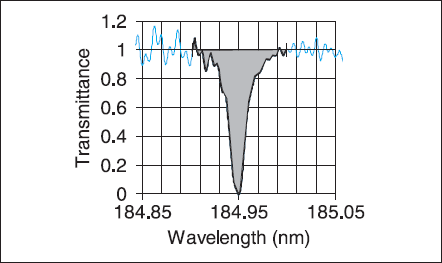
Figure 3. Sample Hg absorption spectrum at 185 nm. This spectrum was recorded along the axis of the custom lamp with an ID of 48 mm, 300 mTorr of Ar, 7.7 A of RF current at 250 kHz and a cold spot temperature of 323 K.
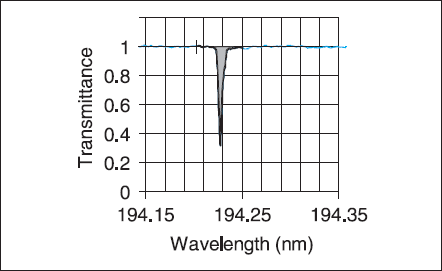
Figure 4. Four Sample Hg+ absorption spectrum at 194 nm. This spectrum was recorded along the axis of the custom lamp with an ID of 48 mm, 300 mTorr of Ar, 6.0 A of RF current at 250 kHz and a cold spot temperature of 323 K.
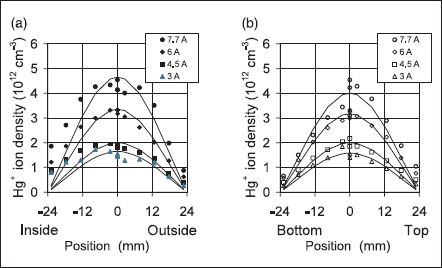
Figure 5. Density of Hg+ ions as a function of offset from the column axis in the horizontal (a) and vertical (b) planes at a rms lamp currents of 3 A (Δ), 4.5 A (□), 6.0 A (◇) and 7.7 A (◯), with a cold spot temperature of 323 K. The solid lines are least-square fits to Bessel function radial distributions, ordered by increasing current from the bottom.
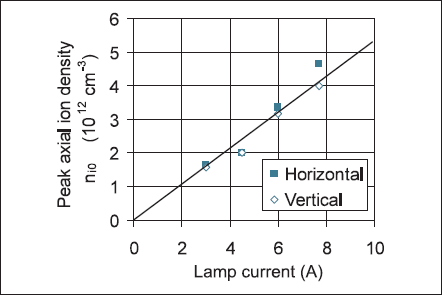
Figure 6. Peak axial density, nHg+(0) of Hg+ ions as a function of rms discharge current with a 323 K cold spot from the least-square fits in figure 5.
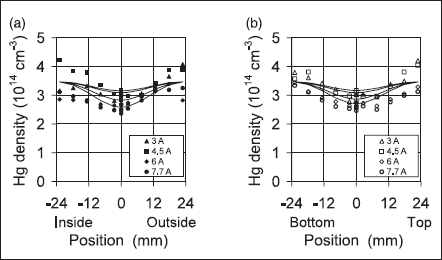
Figure 7. Density of Hg atoms as a function of the offset from the column axis in the horizontal (a) and vertical (b) planes at an rms lamp current of 3 A (Δ), 4.5 A (□), 6.0 A (◇) and 7.7 A (◯), with a cold spot temperature of 323 K. The solid lines are model predictions from equation (5) with the axial ion densities from the least-square fits in figure 5, ordered by increasing current from the top.
5. Summary and discussion
A synchrotron based absorption experiment for measuring absolute column densities of ground level Hg atoms and Hg+ ions in discharge plasmas has been described. First results from this experiment on an electrodeless, high power density Icetron fluorescent lamp show clear evidence for radial cataphoresis in the Hg- Ar discharge. Under typical Icetron operating conditions with ~7 A of discharge current and a cold spot temperature of ~323 K this effect is significant, but not severe. Additional studies of radial cataphoresis under more extreme conditions are planned. New types of fluorescent lamps, including both compact lamps and electrodeless lamps now under development, will operate under more extreme conditions.
Acknowledgments
This research is supported by USHIO Inc. and by NSF grants ECS 99-88282 and DMR-0084402 to the Synchrotron Radiation Center. We are very grateful to Dr Philip Moscowitz, Dr Graeme Lister and Osram Sylvania Inc. for providing the experimental Icetron lamp and to Geoff Bonvallet for assistance early in the experiment.