光技術情報誌「ライトエッジ」No.32(2009年5月発行)
2009.2 日本化学会欧文誌Vol.82
Photochemical Removal of NO, NO2, and N2O by 146nm Kr2
Excimer Lamp in N2 at Atmospheric Pressure
Masaharu Tsuji,*1,2 Naohiro Kamo,2 Takashi Kawahara,2 Masashi Kawahara,2
Makoto Senda,2 and Nobuyuki Hishinuma3
1 Institute for Materials Chemistry and Engineering, Kyushu University, Kasuga 816-8580
2 Department of Applied Science for Electronics and Materials, Graduate School of Engineering Sciences,
Kyushu University, Kasuga 816-8580
3 USHIO Inc., Himeji 671-0224
Received September 1, 2008 ; E-mail : tsuji@cm.kyushu-u.ac.jp
The photochemical removal of NO, NO2, and N2O was investigated in N2 using a 146nm Kr2(25mWcm-2)excimer lamp. The results obtained were compared with those obtained using 172nm Xe2(50 or 300mWcm-2)excimer lamps. The removal rates of NO and NO2 at 146nm were 11 and 36% slower than those at 172nm, respectively. On the other hand, the removal rate of N2O at 146nm was 21 times faster than that at 172nm. The differences in the removal rates are discussed in terms of the absorption coefficient at each wavelength and effects of photoabsorption by N2 at 146nm. By the addition of a small amount of O2 into an N2O/N2 mixture, the removal rate of N2O at 146nm decreased greatly. On the basis of these facts, it was concluded that the 146nm excimer lamp is especially useful for the N2O removal in N2 at atmospheric pressure.
Nitrogen oxides(NOx : NO and NO2), which arise from various industrial sources, are major contributors to acid rain.1,2 On the other hand, nitrous oxide(N2O)in the Earthʼs atmosphere is a major contributor to the greenhouse effect due to its long atmospheric residence time of 120 years and its 310 times larger radiative forcing than that of CO2.1,3,4 Removal methods of NOx and N2O using rare metal catalysts have been extensively studied and widely applied as aftertreatment techniques in automobiles and thermal power plants.5-9 Recently, the cost of rare metal catalysts has increased greatly because of economic growth in developing countries. Therefore, a new low-cost and catalystfree aftertreatment process must be developed to overcome this problem.
We have recently initiated development of photochemical methods as a new promising removal method of NO, NO2, and N2O at atmospheric pressure without using expensive catalysts.10-17 At first, we studied the decomposition of NO2 and N2O using a 193nm ArF excimer laser in N2 at atmospheric pressure.10-13 It was found that 86% of NO2 was converted to N2, O2, and NO after 3min laser irradiation and the formation ratios of N2, O2, and NO, defined as [product gas]/[ NO2]0, were 32, 75, and 22%, respectively.11 N2O was nearly completely converted to N2 and O2 after 20min laser irradiation.13 An advantage of the photochemical method is that N2 is inert to photoirradiation above the 150nm range. Therefore, NO emission due to the decomposition of N2, which generally occurs in an electric discharge of N2/O2 mixtures,18 is negligible. However, when the ArF excimer laser photolysis is applied to practical NOx removal, there are many severe problems such as the expense of the excimer laser apparatus, the high running cost, and the large size and heavy weight of the apparatus including high-power sources. Another disadvantage is that NO, which is generally emitted in exhausted gases, cannot be removed effciently. This is because the dissociation energy of NO(6.50 eV)is higher than that of the photon energy of ArF laser(6.43 eV).19,20
In order to overcome these problems, we used a low-cost and compact 172nm Xe2 excimer lamp as a new vacuum ultraviolet(VUV)light source. Since the photon energy of 172nm(7.21 eV)is higher than the dissociation of NO, not only the decomposition of NO2 and N2O but also that of NO is energetically possible. We have recently studied the removal of NO, NO2, and N2O using 172nmXe2 excimer lamps(50 and 300mWcm-2)in N2 and N2/O2 mixtures.14-17
In the present study, we studied the photochemical removal of NO, NO2, and N2O in N2 using a 146nm Kr2 excimer lamp as an additional VUV source for the removal of these molecules. In Table 1 are summarized absorption cross sections of NO, NO2, N2O, N2, and O2 at 146 and 172nm denoted as σ146 and σ172, respectively, and their ratios, σ146/σ172. The σ146/σ172 ratios of NO, NO2 , and N2O are 80, 0.93, and 65, respectively. Although there is no absorption of N2 at 172nm, N2 absorbs 146nm light. On the basis of these facts, higher removal rates are expected for NO and N2O
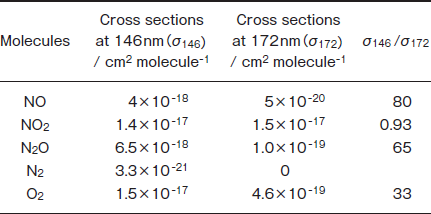
Table 1 :Absorption Cross Sections of NO, NO2, N2O, N2, and O2 at 146 and 172nm (Ref. 19) and Their Ratios
at 146nm, if the absorption of the buffer N2 gas at 146nm does not interfere with the removal of these molecules. The removal rates of each gas and the formation ratios of products at 146nm were compared with those at 172nm. Possible removal mechanisms of NO, NO2, and N2O under VUV photoirradiation are discussed using reported photochemical and gas-phase kinetic data.19-23
Experimental
The VUV photolysis apparatus used in this work was the same as those reported previously.14-17 The inside volume of the photolysis chamber was 185cm3. Lights from an unfocused 146nm Kr2 lamp(USHIO, UER20H146:25mWcm-2, 120‒165nm range, full width at half maximum(FWHM):16nm)and 172nm Xe2 lamps(USHIO, UER20H172 : 50mWcm-2 or USHIO trial product:300mWcm-2 155-200 nm range, FWHM: 14nm)were used to remove NO, NO2, and N2O at room temperature. The diameter and length of the low power commercial Kr2 and the Xe2 lamps were 30 and 200mm, whereas those of the high power Xe2 lamp were 70 and 240mm, respectively.
Experiments were carried out in a closed batch system. The total pressure was maintained at atmospheric pressure. The concentration of NO and NO2 in pure N2 was 1000ppm(v/v), whereas that of N2O in N2 was 100ppm. They were introduced through mass flowmeters. Before and after photoirradiation, outlet gases were analyzed using a HORIBA gas analysis system(FG122‒LS)equipped with an FTIR spectrometer and an ANELVA gas analysis system(M‒200GA‒DTS)equipped with a quadrupole mass spectrometer. The detection limit of gases by the mass spectrometer was ≈0.1%. The lowly sensitive mass spectrometer was used for the determination of N2/O2 ratios of buffer gases, whereas the highly sensitive FTIR system was used for the detection of NOx, N2O, and O3. The light path length and the volume of analyzing chamber in FTIR were 2.4m and 300cm3, respectively. The spectra were measured in the 900-5000cm-1 region with an optical resolution of 4cm-1. The reliable calibration curves of NO, NO2, and N2O for FTIR measurements were supplied by HORIBA Inc. The detection limits of NO2, NO, and N2O were, 1, 1, and ≈0.5ppm, respectively, in our FTIR spectrometer. The concentration of O3 was evaluated from the absorbance of O3 by reference to standard spectral data supplied by HORIBA Inc. We determined the residual amount of a reagent gas A,[A]/[A]0, and the formation ratio of a product gas B,[B]/[A]0, from gas analysis. Here, [A]0 is an initial concentration of A. The fluxes of photons in our 25mWcm-2 146nm and 50mWcm-2 172nm lamps were estimated to be 1.8x10¹⁶ and 4.3x10¹⁶photons cm-2s-1, respectively, indicating that the photon flux of the 146nm lamp is smaller than that of the 172nm one by a factor of 2.4. When the removal rates of NO2, NO, and N2O using the two lamps are compared, they are normalized to these photon fluxes of the lamps.
IR inactive N2 and O2 molecules could not be detected using the FTIR spectrometer. Therefore, no information could be obtained about concentrations of N2 and O2 from FTIR measurements. However, it was possible to evaluate the formation ratios of N2 and O2 from mass balance of N or O atom between reagent and products on the basis of gas-phase reactions shown later, when no products other than N2O, NO, and NO2 were obtained.
The following gases were used without further purification:N2(Taiyo Nissan Inc.:purity >99.9998%), NO(Taiyo Sanso Inc.:2.02% in high purity N2), NO2(Nippon Sanso Inc.: 3630ppm in high purity N2), N2O(Nippon Sanso Inc.: 959ppm in high purity N2), and O2(Nippon Sanso Inc.: >99.99995%). NO and NO2 in N2 and N2O in N2 or N2/O2 mixtures were diluted before use.
Results and Discussion
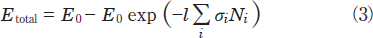
NO Removal in N2. Figures 1a and 1b show FTIR spectra of NO(1000ppm)before and after 146nm photoirradiation. After photoirradiation for 30min, an NO peak at ≈1900cm-1 decreases in intensity by ≈50%, and an NO2 peak at 1620cm-1 appears. The intensity of the NO2 peak is ≈4 times stronger than that of the NO one in Figure 1b because the absorption peak of NO2 at 1620 cm-1 is about one order stronger than that of NO at ≈1900cm-1 at the same concentration. Similar FTIR spectra of NO were obtained after 172nm photoirradiation. Figures 2a and 2b show the dependence of the residual amount of NO and the formation ratios of NO2, N2, and O2 on the irradiation time of 25mWcm-2 146nm Kr2 and 50mWcm-2 172nm Xe2 lamps, respectively. The residual amount of NO at 146 nm decreases to 60, 48, and 34% with increasing the irradiation time to 10, 20, and 30min, respectively. On the other hand, that at 172 nm decreases to 37, 12, and 9% for the same irradiation times. The formation ratio of NO2 at 146nm is about 20% in the 10-30min range, whereas that at 172nm is less than 10% in the same time range.
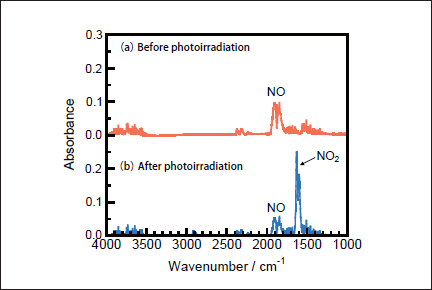
Fig.1: FTIR spectra of NO(1000ppm)in N2(a)before and(b)after 25mWcm-2 Kr2 excimer lamp irradiation for 30min.
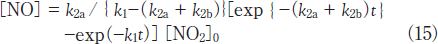
The removal rates of NO under 146 and 172nm photoirradiation were determined assuming that they obey the following simple first-order decay of molecules.
The k1 values of NO were evaluated to be 5.4x10⁻⁴s-1 at 146nm and 1.4x10⁻³ s-1 at 172nm from slopes of plots of ln([NO]/[ NO]0)vs. irradiation time in the 0-30min range. The correlation kinetic coefficients(R2)of k1 values in the linear least square plots were 0.949 at 146nm and 0.962 at 172nm. It is therefore reasonable to assume that the removal rates of NO obey a simple first order. Taking photon fluxes of the two lamps into account, the removal rate of NO at 146nm is 11% slower than that at 172nm. The absorption cross section of NO at 146nm is 80 times larger than that at 172nm(Table 1). Therefore, it is expected that the removal rate of NO at 146nm is much faster than that at 172nm, assuming that the removal rate of NO is governed by the absorption cross section of NO at different wavelengths. However, we found that the removal rate of NO at 146nm is 11% slower than that at 172nm. At 172nm there is no absorption of N2, whereas N2 absorbs 146nm light(Table 1). Thus, we estimated the contribution of absorption by the N2 buffer gas using known absorption cross sections and concentrations of each gas.
In general, the total photon energy absorbed by such a mixture as NO and N2 during passing through the decomposition chamber, Etotal, is given by the relation:
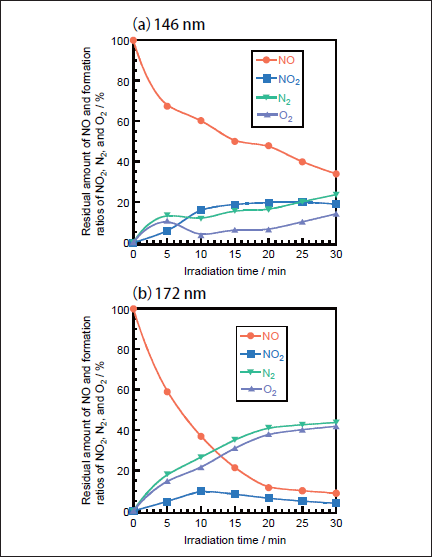
Fig.2: Dependence of the residual amount of NO and the formation ratios of NO2, N2, and O2 on the irradiation time in N2, when(a)25mWcm-2 Kr2 and(b)50mWcm-2 Xe2 excimer lamps were used. The formation ratios of N2 and O2 were obtained from mass balance. The initial NO concentration was 1000ppm.
Here, E0, l, σi, and Ni are the energy of the excimer lamp, the length of the decomposition chamber, the absorption cross section of a molecule i, and its number density, respectively. The photon energy absorbed by a molecule i, Ei, is obtained from the relation:
Although the σN2 value at 146nm is three or four orders of magnitude smaller than NO, NO2, and N2O(Table 1), the NN2 is 103-104 times larger than NNOx and NN2O. Therefore, the absorption of 146nm light by N2 may participate in the photolysis. When we calculated ENO/(ENO + EN2) and EN2/(ENO + EN2) values at 146nm using known σi and Ni values, they were 55 and 45%, respectively. These values suggest that one reason for the slow decomposition rate of NO at 146nm is the absorption of 146nm light by the buffer N2 gas. Although N2 absorbs about half of the 146nm light, the decomposition rate of NO at 146nm is expected to be still 44 times faster than that at 172nm. Thus, another reason must be present for the slow removal rate of NO at 146nm. The absorption spectrum of NO in the 130-200nm range consists of many discrete bands.19 The Kr2 lamp fits a sharp absorption peak of NO at 146nm(σ=4x10-18 cm2 molecule-1). On the other hand, the absorption cross section of NO at 172nm is small(σ=5x10-20cm2 molecule-1). However, there are many other strong absorption peaks in the 155-200nm region of the Xe2 lamp and the maximum absorption cross section of such peaks is 1.6x10⁻¹⁸cm2molecule-1. Some of these strong absorption peaks may also contribute to the fast decomposition of NO using the 172nm lamp, so that the removal rate of NO using 172nm lamp is faster than expected from its small absorption cross section at 172nm.
On the basis of FTIR data, the most probable formation processes of N2 and O2 from NO are VUV photolysis of NO(reactions 5 and 6)followed by secondary reactions 7-9.19-22
On the other hand, NO2 is produced through the following three-body reactions. 20,21
The formation ratio of NO2 at 146nm is larger than that at 172 nm. A major reason for the higher formation ratio of NO2 is that the removal rate of NO2 at 146nm is slower than that at 172nm by a factor of 3.7, as shown in the next section.
NO2 Removal in N2. Figures 3a and 3b show FTIR spectra of NO2(1000ppm)before and after 146nm photoirradiation, respectively. After photoirradiation for 30min, an NO2 peak at 1620 cm-1 decreases in intensity by 80%. Similar FTIR spectra of NO2 were obtained after 172nm photoirradiation. Figure 4a shows the dependence of the residual amount of NO2 and the formation ratios of NO, N2, and O2 on the irradiation time for the 25mWcm-2 146nm Kr2 lamp. For comparison, corresponding data for the 50mWcm-2 172nm Xe2 lamp are shown in Figure 4b.15 The residual amount of NO2 at 146nm decreases to 46, 28, and 19% with increasing irradiation time to 10, 20, and 30min, respectively. On the other hand, that at 172nm rapidly decreases to 13, 8, and 7% for the same irradiation times. Assuming first-order decay of NO2, the removal rates of NO2 at 146 and 172nm, k2, were determined to be 9.0x10⁻⁴ and 3.3x 10⁻³s-1 from slopes of plots of ln([NO2]/[ NO2]0)vs. irradiation time in the 0-10min range at 146nm and 0-30min range at 172nm. The correlation kinetic coefficients(R2)of k2 values in the linear plots were 0.977 at 146nm and 0.95l at 172nm. The correlation kinetic coefficients(R2)of the k2 value in the linear plot at 146nm was 0.787 in the 0-30min range, so we used values in the 0-10min range giving the much better R2 value shown above. Taking photon fluxes of the two lamps into account, the removal rate of NO2 at 146nm is 36% slower than that at 172nm.
The absorption cross section of NO2 at 146nm is 7% smaller than that at 172nm. When the ENO2/(ENO2+EN2)and EN2 /(ENO2+EN2)values are evaluated using eq 4 and known σi and Ni values, they are 81 and 19%, respectively. These values suggest that the contribution of absorption by N2 is smaller than that in the case of NO. The slower removal rate of NO2 at 146nm than that at 172nm is consistent with the difference in the absorption cross sections of NO2 at the two wavelengths(Table 1).
There is a large difference in the formation ratio of NO from NO2 between the two lamps, as shown in Figure 4. The formation ratio of NO at 5 min photoirradiation is nearly the same value of ≈5% for the two lamps. However, after 10min photoirradiation it increases to 8-13% at 146 nm in the 5-30min range. On the other hand, it decreases to zero in the 20-30min range at 172nm. In our previous study, we found that only 14% of NO2 is decomposed to NO+O at 172nm and the rest is dissociated to N+O2 on the basis of kinetic analysis in N2.15
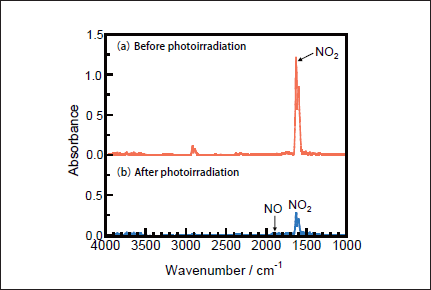
Fig.3: FTIR spectra of NO2(1000ppm)in N2(a)before and(b)after 25mWcm-2 Kr2 excimer lamp irradiation for 30min.
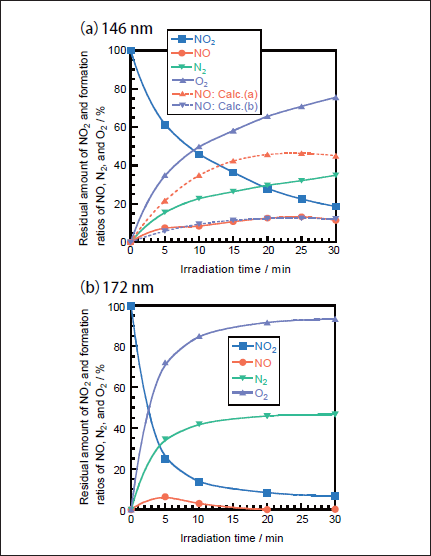
Fig.4:Dependence of the residual amount of NO2 and the formation ratios of NO, N2, and O2 on the irradiation time in N2, when(a)25mWcm-2 Kr2 and(b)50mWcm-2 Xe2 excimer lamps were used. The formation ratios of N2 and O2 were obtained from mass balance. The initial NO2 concentration was 1000ppm. Dotted curves were obtained assuming the branching ratio of reaction 13a in the consecutive reaction 14 to be 100%(Calc.(a))and 27%(Calc.(b)).

We have examined the relative contribution of the two processes at 146nm from a similar kinetic analysis.
Here, the relation k=k2a+k2b holds. At first, we assumed a simple consecutive reaction in the 146nm photolysis of NO2, where the branching ratio of reaction 13a is 100%.

Then, the concentration of NO was calculated as a function of irradiation time using k1 and k2 values obtained in this study. Figure 4a(broken line : Calc.(a))shows the calculated NO concentrations at various irradiation times. It should be noted that the calculated NO concentrations are much higher than the observed ones. On the basis of this fact, not only reaction 13a but also reaction 13b must participate in the photolysis of NO2 at 146nm. In the presence of process 13b, the concentration of NO is given by
When various k2a and k2b values were used to reproduce the experimental data, the best fit curve was obtained at k2a= 2.4x10⁻⁴s-1 and k2b= 6.6x10⁻⁴s-1, as shown in Figure 4a(Calc.(b)). Therefore, the branching ratios of reactions 13a and 13b were estimated to be 27 and 73%, respectively. This shows that the direct dissociation of NO2 to N+O2 occurs significantly at 146nm, as in the case of the photolysis of NO2 at 172nm.15 On the basis of our data for NO2 and NO photolysis at 146 and 172nm, a major reason for the larger formation ratio of NO from NO2 at 146nm than that at 172nm can be explained by the fact that the removal rate of NO at 146nm(k1= 5.4x10⁻⁴s-1)is smaller than that at 172nm(1.4x10⁻³s-1)by a factor of 2.6.
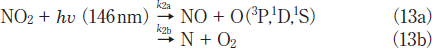
N2O Removal in N2. Figures 5a and 5b show FTIR spectra of N2O(100ppm)before and after 146nm photoirradiation. Since the absorption coefficient of N2O for IR light is large, reliable experiments at low concentration were possible. After photoirradiation for 30min, N2O peaks at 2220 and 1285cm-1 disappear, and no peaks of NO and NO2 are observed. Similar FTIR spectra of N2O were obtained before and after 172 nm photoirradiation. Figure 6a shows the dependence of the residual amount of N2O and the formation ratios of N2 and O2 on the irradiation time of the 25mWcm-2 146nm Kr2 lamp. For comparison corresponding data for the 50mW 172nm Xe2 lamp are shown in Figure 6b. It should be noted that the residual amount of N2O at 146nm rapidly decreases to 10, 1.6, and 0% with increasing irradiation time to 10, 20, and 30 min, respectively. On the other hand, that at 172nm slowly decreases to 80, 62, and 48% for the same irradiation times. From slopes of plots of ln([N2O]/[ N2O]0)vs. irradiation time in the 0-30min range, the removal rates of N2O at 146 and 172nm, defined as k3), were evaluated to be 3.7x10⁻³ and 4.2x10⁻⁴s-1, respectively. The correlation kinetic coefficients(R2)of k3)values in the linear least square plots were 0.983 at 146nm and 0.996 at 172nm. It should be noted that the removal rate of N2O at 146nm is 21 times faster than that at 172nm, taking account of photon fluxes of the two lamps.
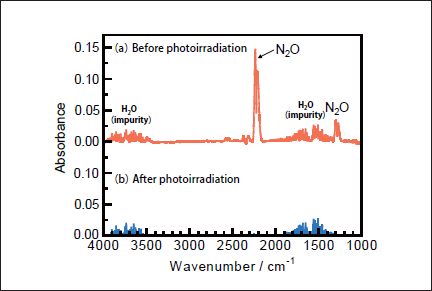
Fig.5: FTIR spectra of N2O(1000ppm)in N2(a)before and(b)after 25mWcm-2 Kr2 excimer lamp irradiation for 30min.
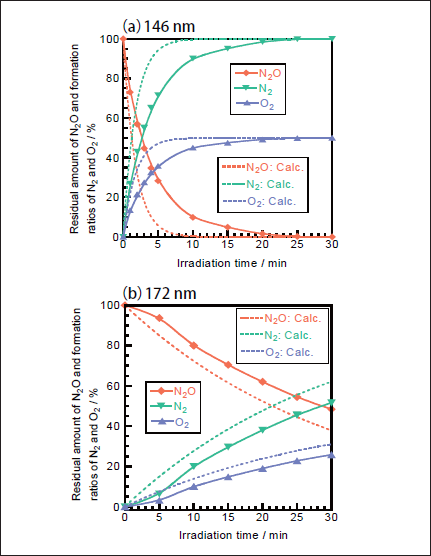
Fig.6:Dependence of the residual amount of N2O and the formation ratios of N2 and O2 on the irradiation time in N2, when(a)25mWcm-2 Kr2 and(b)50mWcm-2 Xe2 excimer lamps were used. The formation ratios of N2 and O2 were obtained from mass balance. The initial N2O concentration was 100ppm. Dotted curves were obtained from model calculation using data given in Tables1 and 2.
The absorption cross section of N2O at 146nm is 65 times larger than that at 172nm(Table 1). In order to examine the relative contribution of N2O and N2 for the absorption of the 146nm light, the EN2O /(EN2O+EN2)and EN2 /(EN2O+EN2)values were evaluated using eq 4 and known σi and Ni values. They are 16 and 84%, respectively. Thus, we can expect that there exists a large contribution of the absorption of N2 in the decomposition of N2O at 146nm under our experimental conditions. This is a major reason why the removal rate of N2O at 146nm is not so fast as expected from its large absorption cross section.
On the basis of our FTIR data, it is reasonable to assume that N2O is efficiently converted to N2 and O2 due to VUV photolysis of N2O(reactions 16 and 17)and subsequent secondary reactions 18 and 8.19-22

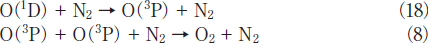
NO may be produced through fast secondary O(1D)+N2O reaction via process 19b.21,22
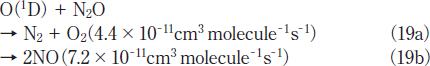
However, under our conditions, the concentration of N2O was sufficiently low(≤100ppm)to suppress the O(1D)+N2O reaction, and NO is dominantly decomposed to N2 and O2 under VUV photolysis. Thus, the formation ratio of NO is negligibly small.
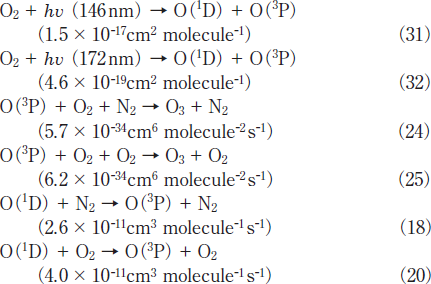
In order to confirm the validity of the above explanation for the VUV photolysis of N2O in N2 atmosphere, the residual amount of N2O and the formation ratios of products were calculated using a similar simulation model to that used for the 193nm ArF laser photolysis of N2O.10,13 The photolysis of N2O by the 146 and 172nm excimer lamp starts from processes 16 and 17. The quantum yield of O(1D)in processes 16 and 17 is known to be 1.0 in the 140-175nm region.22 Although we used a continuous wave(CW)lamp, we applied a simulation model used for pulse laser. In the model calculations, first we calculated the total number of photons irradiated to the photolysis chamber per a unit time using irradiance of the lamp, the irradiation area of the lamp, and the one-photon energy of the 146 or 172nm light. We assumed that our lamp operates as CW pulses with a pulse width of 10ms(100Hz). Then the number of photons absorbed by each molecule within 10ms and concentrations of N2O and products after 10ms were calculated using five photochemical processes and their absorption cross sections at 146 nm listed in Table 1 and eighteen two-body and three-body reactions given in Table 2.19-22 Although the total absorption cross section of NO is known at 146 and 172nm, little information has been reported on branching fractions of products and their electronic-state distributions. In the simulation, we assumed the following photolysis processes at 146 and 172nm : NO→ N+O(3P). When the pulse width was changed to 1ms, similar data were obtained. Thus, the pulse width of 10ms is sufficiently short in our simulation. The simulation data are shown in Figures 6a and 6b by dotted lines. In both cases, N2O is removed more rapidly in the model calculation than the experimental observation. The deviation between the calculated and experimental data at 146nm is larger than that at 172nm. The length of our photolysis chamber is 23cm. In our 146nm photolysis experiments in N2 at atmospheric pressure, incident
photons lose their initial energy exponentially along the light path in the chamber due to the absorption by N2 and attenuate to only 15% at the end of the chamber at 146nm. This strong attenuation of incidence photons at 146nm may be a major reason for the observed slower removal rate of N2O than that predicted from the model calculation.
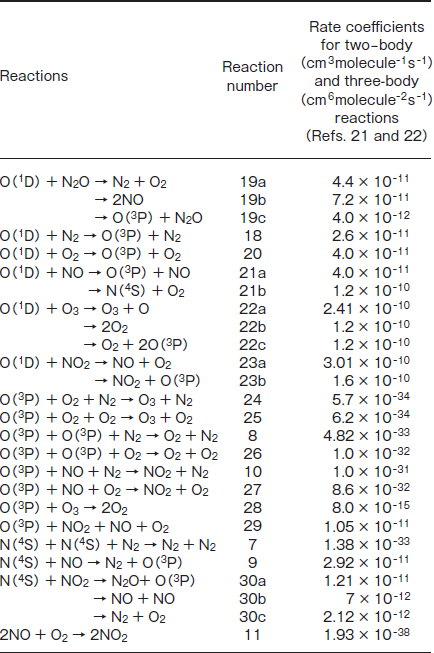
Table 2:Possible Reactions of O(1D,3P), N(4S), and NO with Atoms and Molecules Induced by 146 and 172nm Photolysis of N2O
N2O Removal in N2/O2 Mixtures. For the practical application of the photochemical removal of N2O, effects of O2 must be examined because O2 is generally present in exhausted gases. We have studied effects of O2 in N2/O2 mixtures in the O2 concentration range of 0-30%. Figures 7a and 7b show FTIR spectra observed before and after 146 nm photolysis of N2O(100ppm)in an N2/O2 mixture(O2 20%). Before photolysis, N2O peaks are observed at 2220 and 1285cm-1. After 10min photoirradiation, the N2O peak at 2220cm-1 becomes weak by only about 5% and very strong O3 peaks are observed. No other products such as NO, NO2, and N2O5 were observed. Similar FTIR spectra were observed at 146nm photoirradiation in N2/O2 mixtures(20 and 30% O2)and at 172nm photoirradiation in N2/O2 mixtures(10-30% O2). These data imply that N2O is dominantly converted to N2 and O2 in N2/O2 mixtures under 146 and 172nm photoirradiation under our conditions. O3 is produced from VUV photolysis of O2 followed by three-body recombination reactions.19,21-23
Figures 8a and 8b show the dependence of the residual amount of N2O and the concentration of O3 on the concentratio of O2 in N2/O2 mixtures in the 0-30% range after 10min photoirradiation at 146 and 172nm, respectively. Since the removal of N2O in N2 obeys well first-order decay in the 0-10min range, we observed the residual amount of N2O and the concentration of O3 in N2 /O2 mixtures after photoirradiation for 10min. In Figure 8a, after the residual amount of N2O rapidly increases from 16 to 79% with increasing the O2 concentration from 0 to 1%, it increases from 79 to 90% in the 1-5% range and becomes 92-96% in the 5-30% range. The concentration of O3 increases from 0 to ≈0.55% in the O2 concentration range of 0-10% and becomes nearly constant above that. On the other hand, when a high-power 172nm lamp was used, the residual amount of N2O increases from 16 to 68% and the concentration of O3 increases from 0 to 6.2% with increasing O2 concentration from 0 to 30%, as shown in Figure 8b. These results indicate that the conversion of N2O decreases more rapidly by the addition of O2 at 146nm. The σ146 value of O2 is 2.3 times larger than that of N2O and the concentration of O2 is 100 times higher than that of N2O even at an O2 concentration of 1% in an N2/O2 mixture. Therefore, 97.4% of photons are initially absorbed by O2 in the presence of O2(1%). Under such conditions, the removal of N2O proceeds through the O(1D)+N2O reaction 19 in N2/O2 mixtures. Although the σ146/σ172 ratio for O2 is 33, the concentrations of O(3)and O(1D)resulting from 146nm photolysis of O2→O(3)+O(1D)23 are expected to be lower than those at 172nm under our conditions, because the observed concentration of O3 resulting from the three-body O(3)+O2+M(M=N2 and O2) reactions at 146nm is lower that at 172nm. The lower concentration of O(1D)at 146nm is a major reason for the slower removal rate of N2O at 146nm than that at 172nm in the presence of O2.
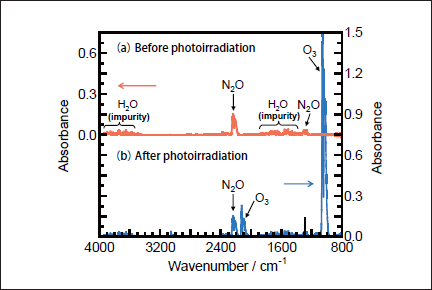
Fig.7: FTIR spectra of N2O(100ppm)in an N2/O2(O2 20%)mixture(a)before and(b)after 25mWcm-2 Kr2 excimer lamp irradiation for 30min.
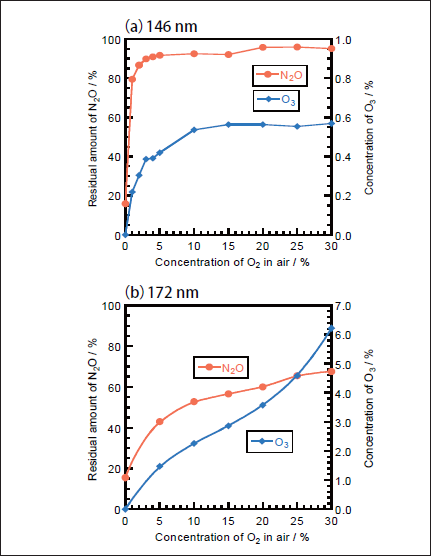
Fig.8:Dependence of the residual amount of N2O and the concentration of O3 on the concentration of O2 in N2/O2 mixtures after 10min photoirradiation of(a)25mWcm-2 Kr2 and(b)300mWcm-2 Xe2 excimer lamps. The initial N2O concentration was 100ppm.
Conclusion
The photolysis of NO, NO2, and N2O in N2 have been studied using a 146nm excimer lamp to develop a new photochemical removal process for NOx and N2O at atmospheric pressure without using any catalysts. It was found that 66% of NO(1000ppm)was converted to N2(24%), O2(34%), and NO2(19%), whereas 81% of NO2(1000ppm)was converted to N2(35%), O2(76%), and NO(11%)in the batch system after 30min photoirradiation. The removal rates of NO and NO2 at 146nm were 11 and 36% slower than those at 172nm, respectively. The differences in the removal rates were discussed in terms of absorption coefficients at each wavelength and effects of photoabsorption by N2 at 146nm. Our results indicate that 146nm photolysis has no great advantage over 172nm photolysis for application to the removal of NOx. However, we found that the 146nm photolysis is effective for N2O removal under N2 in the absence of O2. The removal rate of N2O at 146nm was 21 times faster than that at 172nm. No emission of NO and NO2 was observed.
In this work, we used a head-on type excimer lamp. A disadvantage of this type of lamp is that the irradiation area of the lamp is restricted near the quartz window. Therefore, the contact area between the light and gases is small. If a side-on 146 nm excimer lamp is developed, the contact area between the light and gases will be large, so that a higher conversion of NOx and N2O to N2 and O2 will be obtained. This will be one way for the enhancement of the removal rates of NOx and N2O under VUV photolysis. Thus, the rapid development of a sideon 146nm excimer lamp is required for this purpose.
This work was partly supported by NEDO and the Joint Project of Chemical Synthesis Core Research Institutions.