光技術情報誌「ライトエッジ」No.8(1996年9月発行)
Journal of Non-Crystalline Solids 179 (1994)260-275
Vacuum ultraviolet-induced strain in vitreous silica used
for xenon lamp bulbs
Yukihiro Morimoto*, Tatsushi Igarashi, Tuneo Okanuma
Research and Dvelopment,Ushio Inc., 1194 Sazuchi Bessho-cho, Himeji-city,Hyogo-pref.671-02,Japan
Abstract
Strain was generated by vacuum ultraviolet radiation in speciments of two types of vitreous silica (GE214) and Suprasil P20) in a xenon lamp. Strain energy calulated from the stress was linearly proportional to the energy fluence of the incident light. The density of theilluminated surface increased by about 1% over thi density prior to illumination to adepth of ≤ 200μm. This densification introduced a sterss in the specimens. Point defects such as SISI homo bond, E' center, non-bridging oxygen hole center, SiOH and SiH were observed. Most of these microscopic structure changes occurred in the densified portion of the specimen in which the vacuum ultraviolet light, in the wavelength range 160-165 nm, was absobed. The number of SiSi homo bonds in this layer was larger than the number of other defects generated. A linear relationship between the stress increase and the amount of SiSi homo bonds generated during illumination was observed. We assume that one of the origins of stress generation is the generation of SiSi homo bond. On the other hand, SiOH and SiH in the specimens decreased the magnitude of the stress. The occurrence of stres due to the SiSi homo bond generation and the stress depression by SiOH and SiH were identical within errors of measurement, in thi two vitreous silicas.
1. Introduction
High pressure xenon (Xe) short arc (<1cm) plasmas radiate over the wavelength range from the vacuum ultraviolet (VUV) to the far infrared (IR). Xe lamp bulbs of vitreous (v-)SiO2 absorb most of the VUV light and, consequently little is emitted. Strains are produced which seemed to result from the VUV light absorption in the lamp bulb. In the worst cases bulbs fractured because of the strain. It has been reported that, in the outer bulb of mercury lamps, UV-induced strain takes place and increases during operation[1-3]. A measure to reduce the induced strain is deposition and sintering of a titanium dioxide film to the inner surface of a bulb to absorb UV light and to decrease damage to the v-SiO2 bulb[4].
The UV absorption film has been used for Xe lamps employed as sources of visible light and for reducing production of ozone(O3)gas. In these cases, the source cannot be used as a UV-VUV light source. Although it was clear that the strain occurred and increased in bulbs exposed to VUVIR light and heated by hot plasma, there is no microscopic evidence of the structure of the strained glass nor of the process by which the strain is produced. If the microscopic source of the strain is known, then it may be possible to reduce its magnitude and growth. Silica can then be used as the bulb of a UV-VUV light source.
In the experiments, macro- and microscopic structure changes of the strained silicas were investigated. We propose that macroscopic structure changes are accompanied and produced by microscopic ones. Information obtained from microscopic observation will help to determine the process for the macroscopic effects. We show that strain was produced, densities increased and deformation occurred when silica was illuminated with Xe plasma light. These effects were observed from macroscopic changes. Microscopic changes were deduced from effects on electronic states, e.g., optical absorption. The depth profiles of these microscopic changes were measured. By introducing a small amount of hydrogen into a bulb;the lamp potentials (arc stabilizing, increasing brightness, etc.) are higher, and the rate of increase of the starain was reduced.
2. Experimental procedures
2.1. sample preparation
Silica used as specimens were GE214 and Suprasil P20, purchased from General Electric Co. and Shinetsu-sekiei Co., respectively. The specimens were plates 20×10×2 mm3 . Specimens were placed a 2kW Xe lamp (Ushio UXL-2003HKL-O) and illuminated with Xe short arc plasma light directly to reproduce phenomena which occurs in a Xe lamp bulb. The volume of the lamp was 100cm3 and it was filled with Xe gas at a pressure sof ~7×10⁵ Pa. Hydrogen (H2)gas was mixed in Xe balance gas at concentration of approximately 0.2 vol.%. Some specimens shown in Table 1 were irradiated without H2. Introducing H2 in a Xe lamp stabilized the discharge and increased the radiation flux by increasing the lamp voltage. The distance between the arc plasma and the specimens was 2.5 cm. The periods of the illuminations were from 110 to 1440 h. In Table 1 we list the specimens and the conditions of exposure. The fluence, which is the Integrated flux, was calculated using an equation based on a relation that 40% of electric input power is converted into radiation[5]:

where S is the illuminated surface area (2cm2), r is the distance between plasma and the specimens put into the bulb and t is the illumination time (in seconds).
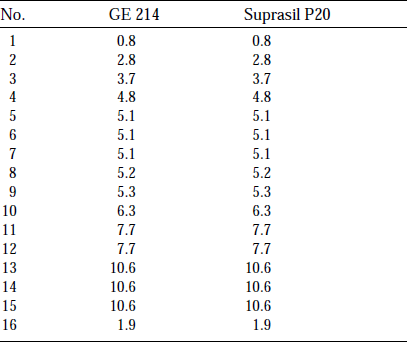
Table 1 List of specimen and energy fluence (unit is ×107 J/specimena)
aEnergy fluence is calculated by Eq.(1).
bThe specimen’s dimension was 20×10×2mm3 other than GE214 No.16. 10×10×0.1mm2.
2.2. Measurements of Xe lamp emission and transmission of sapphire window
To our knowledge, there is no report of the spectra of high pressure Xe arc plasma over the wavelength region of VUV-UV. There has been only one description[6]. The spectral distribution of Xe short arc plasma used for illuminating. v-SiO2 specimens was measured in a Xe lamp (Ushio UXR-300A), the emission window of which a sapphire plate. Using a VUV spectrometer with a wavelength resolution of 0.85 nm (Acton Research Corporation VM502), spectral intensity was measured from 140 to 250 nm. These measurements were performed in a chamber through which oxygen, at a partial pressure ~ 6.7Pa, and nitrogen flowed. After measuring the emission spectra, the lamp was opened and the absorption of the sapphire window was measured using a spectrometer equipped with deuterium lamp. The spectrum of high pressure Xe arc plasma radiation was obtained from these two sets of data.
2.3. Macroscopic observation of illuminated specimens
Cracks, flaws and the appearance of the specimens after illumination were observed by optical microscopy (Olympus BHSM-313MU)and field emission scanning electron microscopy (Hitachi S-4100).Deformations of several specimens were measured by counting numbers of Newton’s rings that appear on a curved specimen placed on an optical flat and illuminated with diffused light [of a HeNe laser](Ushio UNL-305P-BMS; wavelength,λ =6328Å). The magnitude of deformation(ΔD) was calculated by[7]

where X is an integer number of the dark fringes from the center of rings to a specimen’s edge. The subscripts 1 and 2 indicate after and before illumination in the lamp, respectively.
The refractive index, n, was measured for the specimens prior to and after illumination using a refractometer( Carl Zeiss Jena PulfrichRefractometer PR-2)at 25%C. A HeNe laser was used as a light source. The prism used in the measurements was GOF3 (n=1.73506 at 6328 Å).An organic liquid(n=1.5838 at 6328 Å) composed of cedar oil and 1.1.2.2-tetrabromoethane was injected between specimen and the prism. The index of refraction is calculated by

where N is the index of refraction of the prism and ν is the critical exit angle. The errors of n were estimated by multiple measurements (three to five). Using an equation expressing the relation between the density ρ, and n, the density changes, Δρ,were calculated[8]:


All of the illuminated silica plates were examined by means of a photoelastic method to evaluate the degree of VUV-induced strain.In our system, the specimen was placed between two polarizers,so that the rotation of the plane of polarization due to birefringence was detected. A halogen lamp was used as a light source and the intensity of the exit light was recorded by a CCD camera as retardation was changed from the rotation of the plane of polarization. The observed area of specimen was 11.7×2mm2 . Fig.1 shows examples typical of photoelastic obserbations of illuminated specimens in which the magnitudes of retardation, determined for specimens GE214 No.4 and No.7, are represented by colors. The Xe plasma was located above the specimen in illumination; thus , the upper side was the illuminated surface.
Strain was observed over the entire plane of the specimen and the maximum intensity of retardation was almost the same for all the specimens. For example, the values for GE214 No.4 and 7 were the same, 3.95×10⁻⁷ m within errors of ± 5%. However,since the distribution of the retardation differed from specimen to specimen, we cannot determine the strain by the maximum retardation. In this paper, the degree of strain was evaluated by average stress generated, σAV, in the measured area. σ is given by[9]

where C is the photolastic constant (4.22×10⁻¹²Pa-1[10]),W is the length of light path in specimen(1×10⁻²m) and R is the retardation (m).σAV is calculated as follows:

where the factors a,b,c...represent the fractional areas of each degree of stress generated (a+b+c...=1); the subscript indicates the center value of each range of retardation, e.g.,σ45 is the stress at the center value of the retardation from 40×10-9 to 50×10-9m. The errors of σAV were evaluated by multiple measurements and calculating the difference between the average and maximum deviant value, estimated to be ±11%.
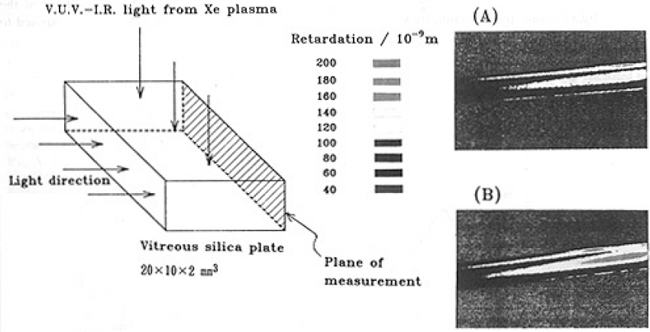
Fig.1. Typical geometry of photoelastic observation and examples of the results obtained for GE214 plates of (A) No.4 and (B) No.7.
2.4. Microscopic observation of illuminated specimens
UVU-UV and IR absorption spectra measurements were performed to determine the absorption bands generated in the specimen after illumination and prior to using the VUV spectrometer and FT-IR (Digilab FTS-40), respectively. The optical densities of absorption bands were obtained by subtracting the spectrum before illumination form the spectrum after illumination and dividing by the thickness. No other treatment, e.g., band separation, was performed. The errors of optical densities were evaluated by multiple measurements and calculating the difference between the average and maximum deviant value; they were estimated to be ±1.5% at 164 nm and 2.73µm, respectively. The resolution for measuring VUV-UV spectra was 2.5 nm and that for IR was 2 cm-1.
In addition, EPR measurements were carried out for specimens(0.1 mm thick) after Xe illumination (fluence ~1.9×10⁷ J/each surface) using a 10 GHz spectrometer (JEOL Model FE-3X).
All measurements were carried out applying 100 kHz field modulation.Spectra of oxygen-hole centers (OHCs) and E' centers were recorded at 77 and 300 K, respectively. Concentrations of paramagnetic centers were measured by a comparison method. A single crystal of CuSo4・5H2O was used as a spin standard. Microwave power adopted to evaluate spin concentrations was 50mW for OHCs and 10-3m W for E' centers.
Absorption bands due to SiOH and SiH were observed in the IR spectra at 2.73 and 4.44µm, respectively. However, the origin of the species generated during illumination could not be identified from the IR spectra. Gases, H2, H2O and O2,released from specimens were measured by using gas release analysis equipment[11]. For the measurement, the specimen was put into a v-SiO2 tube connected to the equipment and heated isochronally under vacuum (5×10⁻⁷ Pa). The effective pumping speeds were 67 and 45 l/s for H2 and O2, respectively. VUV-UV and IR absorption spectra were also recorded before and after gas release measurements.
Depth profiles of concentrations of the detected point defects were examined by etching the specimens with 9.4% HF and 2.5% H2SO4.The etching depth was measured with a micrometer with errors of ±5%. Strain and refractive index were measured after some of the etching steps.
3. Results
3.1. Spectral intensity distribution of Xe plasma
The spectral intensity distribution of UXR-300A,Φm(λ),and transmittance of the sapphire plate used as the window of the lamp over the wavelength of 150-250 nm, T %(λ), were measured. Divided by the transmission spectrum of sapphire, the Xe arc plasma spectrum including O2 absorption,Φ(λ),was estimeted:

The spectrum obtained was corrected with respect to light absorption due to O2 gas by using [12]
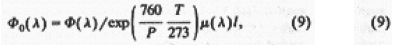
where Φ0 (λ) is the spectral intensities of the Xe plasma estimated as a function of wavelength, P is the pressure torr T is absolute temperature, µis the absorption coefficient[13] and l is the length of the absorbing layer. The spectrum is shown in Fig. 2. The features of this spectrum are:
- (1) a radiation band at around ~175±15nm is superimposed on the Xe continuum spectrum;
- (2) a radiation band beginning at 158.5 nm increased to maximum at 166.5 nm and then decreased gradually at longer wavelengths;
- (3) the continuum spectrum increased gradually from 190 nm to 250 nm.
According to the Refs. [6,14,15] the radiation band appearing in the VUV region can be attributed to the emission of a Xe excimer(Xe2*).
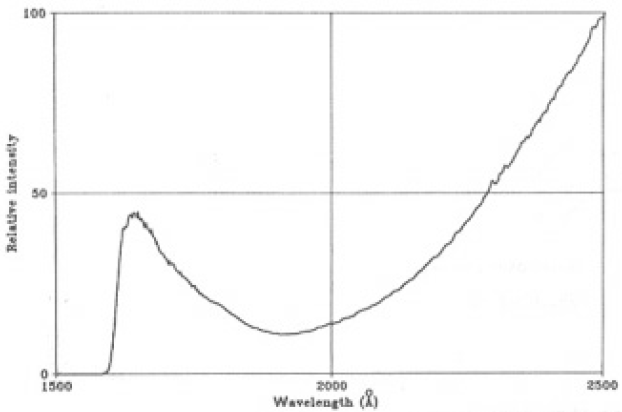
Fig.2. High pressure Xe arc plasma spectrum estimated from measured radiation spectrum and sapphire transmission spectrum.
3.2. Relationship between fluence and macroscopic structural changes
No cracks or flaws, observed in a microscope or in FE-SEM, were detected. Deformation was observed in all illuminated specimens and was measured. Using Eq.(2), the deformation was 4.4± 0.2µm for specimens GE214 Nos.2,9,14 and Suprasil P20 No.1. The magnitude of the deformation was similar in specimens exposed to photon doses which differed more than one order of magnitude.
The refractive indices of the GE214 specimens prior to illumination were 1.4573±0.0001 and 1.4571±0.0001 for the Suprasil P20 specimens.The changes of index of refraction, Δn, on the illuminated surface were +0.0040±0.0002 and + 0.0032±0.0002 for GE214 No.9 and No.15, respectively, and +0.0033±0.002 for Suprasil P20 No.1. The magnitude of increased density, Δρ,calculated form Eq. (5) was 0.021±0.003, 0.016±0.003 and 0.017±0.003gcm-3 for GE214 No.9, 15 and Suprasil P20 No.1, respectively. 1% densification is approximately equal to that produced by 1.8 MeVH+ irradiation at a particle density of 2×1016cm-2 [16].
The relations between averaged induced-stress, σAV and energy fluence are shown in Fig.3(A) for GE214 and Suprasil P20.Values of σAV for suprasil P20 were much less than for GE214.
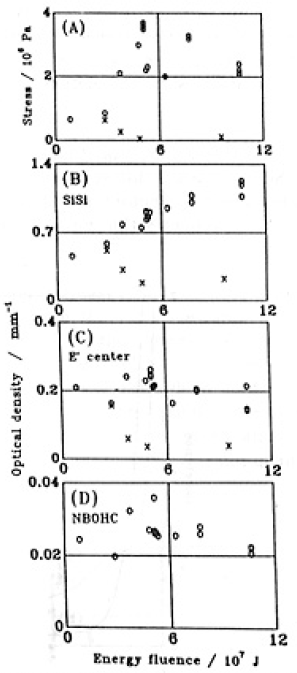
Fig.3. Relationship between energy fluence and (A) averaged stress, and optical sensity of SiSi homo bond (B), E' center (C) and NBOHC (D) The energy fluence was calculated by Eq. (1) The value have errors of ±11, ±1.5, ± 1.5 and ±20% for (A), (B), (C) and (D), respectively. ○, GE214; ×, Suprasil P20.
3.3. Microscopic structure changes
Fig.4 (A) shows typical examples of VUV-UV absorption spectra of 2 mm thick GE214 and Suprasil P20 samples prior to illumination. Absorption bands at around 245+15, 165±10 and ~220 nm can be seen in the spectrum of the GE214 specimen. The absorbance in Suprasil P20 at wavelengths>170 nm is <0.1 cm-1, and increased toα>2cm-1 between 170 and 160 nm. Fig.4(B) shows a typical VUV-UV difference spectra obtained by subtracting the spectrum before illumination from the spectrum after illumination for GE214 No.4 and Suprasil P20 No.3. For Ge214, absorption bands were produced at 164 ,215 and 265 nm. Although no spectrum is shown in this paper, the absorption band at 245 nm of the GE214 specimen was bleached by illumination. Band at 164 and 210 nm were resolved in the spectrum for the Suprasil P20 specimen.
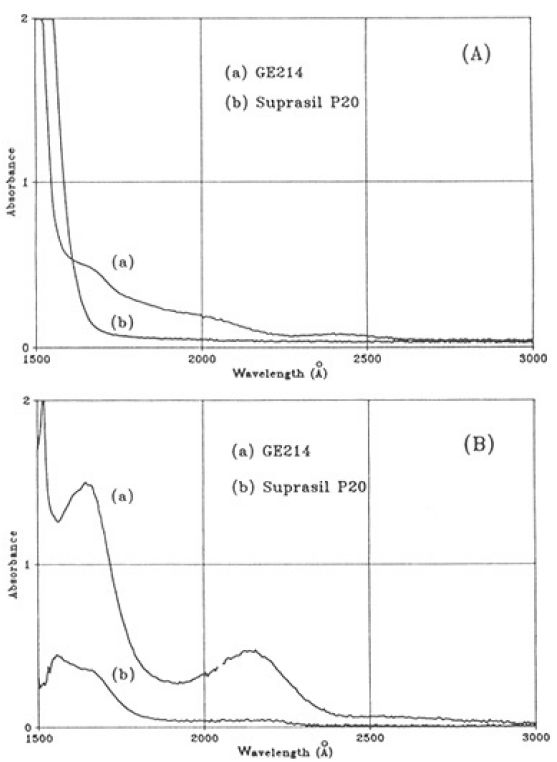
Fig.4. Typical VUV-UV absorption spectra of GE214 and Suprasil P20: (A) prior to illumination; (B) diffence spectra after illumination fluence of 4.8×10⁷ J to show the absorption band generated. Absorbance shows as the specimen's thickness of 2mm.
In the EPR spectra (not shown), E' centers[17] and non-bridging oxygen hole centers (NBOHC,[18,19]) were observed in the GE214 No.16 specimen, the thickness of which was 0.1 mn. The peroxy radical (POR, [20]) was not detected. We assigned the absorption bands at 164, 215 and 265 nm to SiSi homo bond[21], E' and NBOH centers, respectively by reference to prior literature[17,18]. The spin densities of E' and NBOH centers were in the order of 1017 and 1016cm-3, respectively. The relationships between the intensities of the defect signals and the energy fluence of illumination are shown in Figs. 3(B)-(D) for both types of specimen.
The IR difference spectra (not illustrated) showed that the intensities of bands at 2.73 and 4.44µm in the GE214 specimens increased. These are due to SiOH and SiH, respectively [11,22,23]. The concentrations differed from each other. Assuming that the concentration distributions of SiOH and SiH were homogeneous in the specimens, the concentrations, C, of these species were calculated by using the relation

where C is the concentration (number cm3) of SiOH or SiH,ΔA is the difference of absorbance between the specimens before and after illumination, t is the specimen’s thickness (2mm),∈ is the molar extinction coefficients which is 701/mol cm for SiOH and 40 l/mol cm for SiH [11] and An is Avogadoro's number. The concentration of SiOH' was almost the same as SiH..A plots of the concentrations of SiOH versus SiH in the GE214 specimens are shown in Fig.5. On the other hand, there was no change in the magnitudes of absorptions due to SiOH or SiH for Suprasil P20.
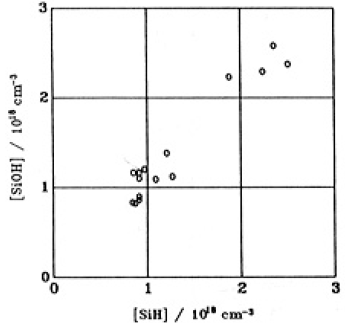
Fig.5. Plots of the concentrations of SiOH and SiH generated in GE214,. assuming their distributions were homogeneous.
Fig.6 shows the relation between the averaged stress and microscopic changes produced by illumination, i.e., the creation of SiSi,E' and NBOHC degects.
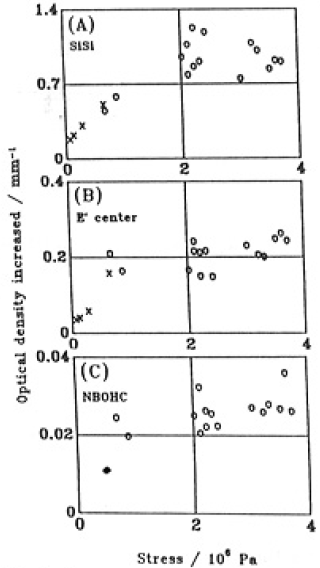
Fig.6. Relation between the averaged stress and increaded optical density of SiSi homo bond (A), E' center (B) and NBOHC (C).○, GE214; × Supprasil P20
3.4. Results of gas release measurements
Release of H2 gas by GE214 No.10 and Suprasil P20 No.2 are shown in Figs.7(A) and (B), respectively. The curves for the illuminated and unilluminated specimens are labeled(b) and (a),respectively. H2 was released from illuminated GE214 in the range 600°C(115 min after starting to heat) to 1000°C(200 min). Neither O2 nor H2 gas was released from unilluminated specimens from 700 to 900°C. For Suprasil P20, H2 gas was released from an unilluminated specimen in the temperature range 150°C(24 ln after starting to heat) to 900°C(180 min). After illumination, on the other hand, the range of temperature in which H2 gas was released was 600-1000°C. The maximum in this temperature range increased after illumination. The temperature range of the specimen during illumination in the lamp was estimated to be about 600°C based on these data. The releases of O2 gas from GE214, in illuminated specimens, occurred in the higher temperature range with the maximum release at 1000°C (data not shown).
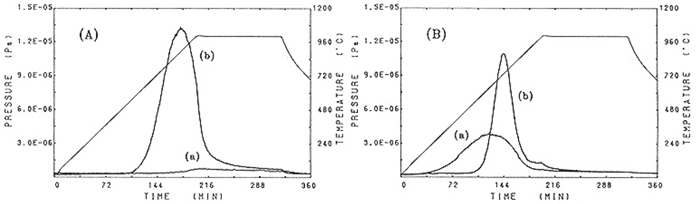
Fig.7. H2 gas release curves measured (a) prior to and (b) after illumination of (A) GE214, (B) Suprasil P20.
Table 2 shows the amounts of H2 and O2 detected in gas release measurement and the numbers of SiOH determined by IR absorption measurements for several GE214 and Suprasil P20 specimens. SiOH numbers were obtained by multiplaying the volume of specimen (0.4 cm3) by the concentration calculated from Eq. (10) andΔA was the difference of absorbance at 2.73 and 2.63µm.In the following we summarize these data.
- (1) SiOH concentration of unilluminated GE214 did not change by heating under vacuum.
- (2) SiOH concentration in illuminated GE214 after the gas release measurement was almost the same as in the unilluminated specimens,but SiH decreased.
- (3) The decrease in the number of SiOH, determined from the IR absorption, was approximately equal to the amount of H2 molecules detected in the gas release measurement.
- (4) For Suprasil P20 which contains two orders of magnitude more SiOH than GE214, the number of SiOH also increased after illumination.(The amount of SiOH was not quantitatively determined because of its higher SiOH contents and errors of measurements).
- (5) Unilluminated Suprasil P20 released H2 gases; however,absorption intensity due to SiOH at 2.73µm did not chage.
- (6) The SiOH concentration of illuminated Suprasil P20, on the other hand, decreased after the gas release measurement.
- (7) Increased number of SiOH in GE214 NO.3, which was put into a lamp together with Suprasil P20 No.2, was 4.4×10¹⁷ which is in agreement with the amount of released H2 from Suprasil P20 No.2. Presumably the SiOH concentration of Suprasil P20 increased as a consequence of a reaction with H2 in the lamp gas mixture.
From this fact, even if the concentration of SiOH of Suprasil P20 is not determined exactly by IR absorption measurement because of measurement errors, this concentration can be estimated from the measured SiOH concentration of the GE214 specimen which was illuminated together with Suprasil P20.
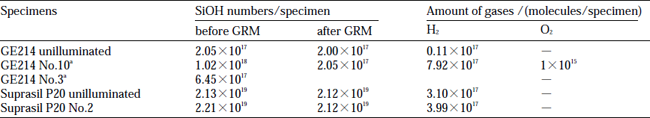
Table 2 Numbers of SiOH determined from IR absorption and amount of H2 and OM2 detected in gas release measurements (GRM)
The values have errors of ±3% and ±5% for number of SiOH determined from IR measurements and amount of H2 and O2 molecules detected in GRM, respectibely.a H2 gas introduced.
3.5. Depth profiles of structure changes
Fig.8 (A) shows on a semi-log scale the depth profiles of concentrations of SiSi homo bonds for GE214 Nos.2,8 and 13 measured after successive etchings. Relative concentration profiles of SiOH and SiH, E' center and NBOHC are also shown in Figs.8(B) and (C), respectively, for GE214 No.8 . Here, using 2×10⁴ l/mol cm as ∈ of SiSi calculated from 7.5×10⁻⁷cm2 absorption cross-section[24] and substituting t of etched thickness into Eq.(10), the SiSi Concentration can be obtained. Although the absorption due to SiOH is also in this wavelength region, ∈ for SiOH at ~164 nm was estimated to be ~34 L/mol cm by making use of the reported SiOH cross-section of 1×10-19cm2 [25]. Considering the low value of ∈ of SiOH, the effect of absorption due to SiOH can be neglected.
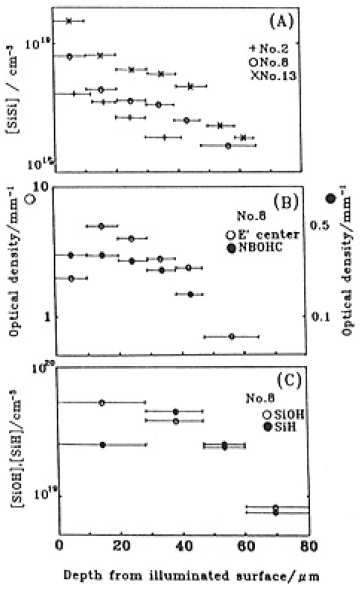
Fig.8. Depth profiles of (A) the concentration of SiSi homo bond for GE214 Nos. 2, 8 and 13, (B) optical densities of E' center and NBOHC for GE214 No. 8 and (C) the concentration of SiOH and SiH for GE214 No.8. Errors of concentrations and optical densitied were ±5-10%. Bars represent the etching depth.
The concentrations of SiSi bonds increased with increasing fluence in the near surface region. SiSi was detected to depths between 200 and 250µm. These three concentration profiles were fitted to a function, C = a exp(-bt), by, a least squares method with the data from etching to a depth of 60µm:
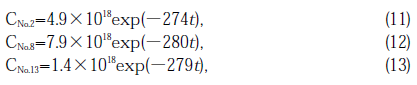
The constants in the exponentials had an average value = 277±3cm-1.
Major fractions of the other sefects existed wethin 100µm of the surfacce snd also decreased linearly with depth up to 100µm. For depths > 100µm, E' centers were destrebuted through-out the GE214 dpecimen and comcentrations were almost constant. The intensities of optical absorption due to NBOHCs were less than for E' centers and detection was difficult. The NBOC was detected to a depth of 240 um. Concontrations of SiOH and SiH appeared to be approximately equal. SiOH was detected to a depth < 225µm which corresponded to that for NBOHC. Tha E' center concentrations are plotted vs. SiH and NBOHC vs. SiOH in Fig. 9, where we assume that the SiH and SiOH were present to a depth of 100 µm.Depth profiles of SiSi concentration of Suprash P20 No. 4 are shown in Fig. 10 with the curve which was fitted to the data for GE214(Fig.8(A)). These plots were similar to the case of GE214 as the concentration decreaded exponentially with depth to 80 um. The comcentration profile for SiSi bonds evaluaated in the same way as GE214 can be expressed as

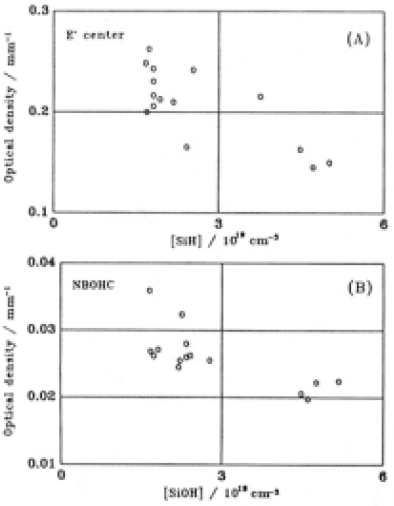
Fig.9. Plots of the concentrations of (A) E' cinters versus and 100-140μm in Suprasil P20. The refractive SiH, (B) NBOHCs versus SiOH, The thickness of SiH and SiOH containing layer was assumed to be 100µm. The errors of E' center and SiOH were ± 1.5%. Those of NBOHC and SiH were ± 20%.
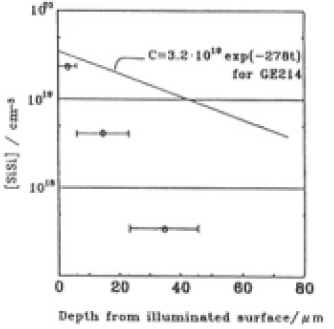
Fig.10. depth profiles of the concentration of SiSi homo bond for Suprasil P20 No.4 (datapoints). Bars represent the etching depth. Straight line represents a fit to the corresponding date for GE214.
The factor in the exponential for Suprasil P20 is more than four times greater than that for GE214. The stress over the specimen completely vanished after etching to a depth of 240µm. Fig.11 shows how the averaged stress residual and the relative amount of SiSi bonds changed after each etching step. The etch rate decreased at depths >66µmin GE214 and >46µm in Suprasil P20. Although not shown in this figure, the refractive index decreased but was not the same value as that of an unilliminated surface. The figure also shows that the stress disappeared at the depths at which SiSi bonds vanished; however, the decrease in SiSi bonds and the decrease in stress were not similar. The depths at which SiSi bonds and stress disap-peared was in the region of 200-240µm in GE214and 100-140µm in Suprasil P20. The refractive index of both specimens at the depths at which the stress disappeared was the same as that of unilluminated specimens.
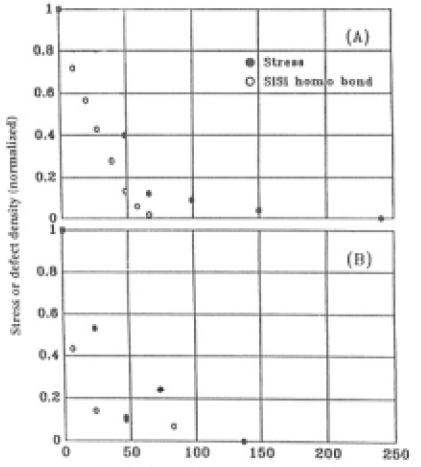
Fig.11. The relative amount of stress and SiSi homo bond concentrations after illumination following each step of etching for (A) GE214 and (B) Suprasil P20.
4. Discussion
The point defects generated in GE214 and Suprasil P20 by illumination with Xe plasma light appeared as absorption bands in VUVU-UV spectra. The absorption bands at 164,215 and 265 nm have been attributed to SiSi homo bond or POR, E' center and NBOHC. In EPR measurements,E' and NBOH centers were clearly observed in GE214, but peroxy radicals were not detected. Consequently, we assigned the 164 nm band to SiSi on our specimens. Changing concentrations of these defects were not correlated with fluence above a value of ~1×10⁷ J or with the stress generated.
4.1. Dependence of stress generation on energy fluence and SiOH concentration
The magnitude of stress can be estimated from the curvature of the specimen by using the equation[26]

where r is the total radius of curvature, R, plus distance from concave surface to boundary where the tensile stress changes to a compressive one, y is the distance between the boundary and convex surface and E is the Young's modulus, 7.3×10¹⁰ Pa[10]. R is calculated by [7]

where x is the distance from center of a Newton’s ring to the edge of the specimen; in the case of Supraisil P20 No.1,10 mm, n is the number of the ring, 14, and λ is 632.8×10⁻⁶ mm. Assuming the boundary is at 1 mm from the concave surface,σ was estimated to be 6×10⁶ Pa. This value was about the same as the averaged stress observed for specimen containing little SiOH, i.e., GE214 No.5. Hence, the deformation produced by illumination can be treated as an elastic deformation.
The rate of density change of v-SiO2 irradiated with ν-rays depends on SiOH content [22]. Taking into account these two facts and converting the stress into strain energy, we obtain relationships between the strain energy and energy fluence shown in Fig.12 for several different SiOH concentrations. Here, the strain energy, U (N m/m3),[27] is estimated by

where σ was the value obtained though Eq.(6). Selecting data for three groups of specimens representing different ranges of SiOH concentrations in the surface 100µm layer, i.e. groups characterized by [SiOH] (a) 1.7±0.05×1019cm-3, (b) 2.35± 0.05×1019cm-3, and (C) 4.6 ±0.15×1019cm-3,and drawing a line from the origin of these plots, results in the three straight lines shown in Fig.12.
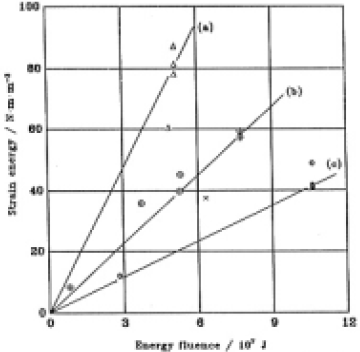
Fig.12. Relationship between the energy fluence and the estimated strain energy. SiOH concentrations (cm-3) were in the range of (a) 1.7±0.05×10¹⁹, (b) 2.35±0.05×10¹⁹ and (c) 4.6±0.15×10¹⁹. Δ, [SiOH] <2.0×1019cm-3 ; ○+, 2.0×10¹⁹ ≤ [SiOH] ≤ 2.5×1019cm-3 ; ×, 2.5×10¹⁹ ≤ [SiOH] <3.5×1019 cm-3, ○ , 4.5×1019cm-3 ≤ [SiOH].
It was found by this way that the strain energy increased linearly with increasing fluence for constant SiOH concentration. The rate of strain energy increase (RIS) decreased with increasing SiOH concentration. The SiOH-concentration dependence of the RSI (strain energy/fluence) is plotted in Fig.13. A second order regression fit to the data is

where Ef is efficiency of RSI/10-13 cm-3 and C is (1/SiOH conc.)/10-20cm3. The correlation coefficient was 0.94.
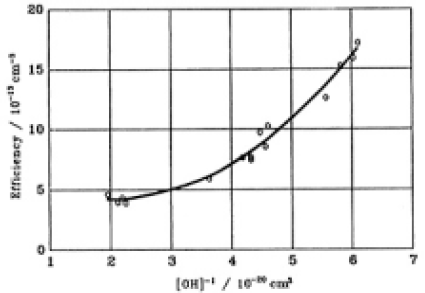
Fig.13. Dependance of the rate of strain energy building up (RSB) upon the concentration of SiOH. A second order regression fit was made on the plots.
4.2. Origin of stress generation
For a GE214 specimen, the strain energies, U,were calculated using Eq.(17) and converted into σ for case of SiOH concentration of a layer 100µm deep being 2×1019cm-3. Amounts of SiSi bonds in this layer were determined and are plotted in figure(14) as a function of calculated σ. SiOH concentration of all Suprasil P20 specimens were in the range of 7-10×1019cm-3 estimated from the SiOH concentration of the GE214 specimen illuminated together with Suprasil P20 specimens (see Table 1) and that contained in itself. Fig.14 represents the linear relations between σ and amount of SiSi bonds. It appeared that the stress was detected only after some SiSi generation. This threshold of SiSi concentration was 7×10¹⁷ and 1×1018cm-3 for GE214 and Suprasil P20, respectively.Figures 14(B) and (C) show the plots of absorption intensity of E' center and NBOHC versus σ. These intensities are independent of above ~1×10⁶ Pa.
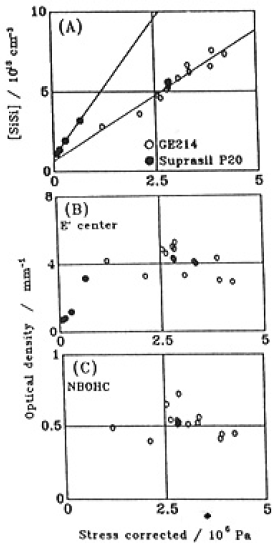
Fig.14. Relation between the stress corrected in terms of SiOH concentration and (A) the concentration of SiSi homo bond, (B) optical density of E' center and (C) optical density of NBOHC. ○, GE214 ; ●, Suprasil P20.
In the experiments for determining depth profiles, the following items about generation of defects and stress for GE214 and Suprasil P20 can be summarized.
- (1) Major fractions of defects generated by illumination with Xe plasma light are within 100µm of the illuminated surface.
- (2) The concentration of SiSi bonds (1018cm-3) was more than one order of magnitude greater than order types of defect,i.e., E' center (1017cm-3) and NBOHC (1016cm-3).
- (3) The number of SiSi bonds and also the stress generated decreased when material was removed by etching the surface and disappeared at the same depth.
- (4) For constant SiOH concentration, SiSi concentration was directly proportional to the stress generated. From these facts, we attribute stress generation to formation of SiSi bonds.
4.3. Wavelength dependence of stress generation
Assuming that the amount of SiSi home bond generation is proportional to the intensity of incident light, the wavelength of the light contributing to SiSi generation could be estimated from the depth profile. The distribution of SiSi bonds in the specimen is shown in Fig.8 and the slopes of the concentration distribution have been evaluated as in Eqs.(11)-(14).
Godmanis et al.[28] reported the application of the Urbach rule in v-SiO2 with the absorption coefficient in VUV region expressed as

where, the characteristic parameter, S, of Eq.(19) is given by the expression

α0=105.5cm-1, E0=8.7 eV, k is Boltzmann’s constant, S0=0.54 and hω0=58×10-3 eV. Using the above equation, E, converted into Λ, was calculated at T=600°C(873K) which was the temperature of the specimen during illumination estimated from the gas release data. In calculation,120.3=(227/ln 10) was used as value ofαfor GE214 and 574.6 for Suprasil P20. The wavelength determined for GE214 was 164 nm and for Suprasil P20 was 159 nm. The depth for Suprasil P20 at which SiSi homo bond and stress disappeared was less than in GE214 as seen in Fig.11. The generation rate of SiSi bonds in Suprasil P20 is less than in GE214(Fig.3(B)) because the radiation intensity at 164 nm was stronger than that at 159 nm(Fig.2) and the absorbance of GE214 in the wavelength range of Xe*2 emission was larger than that of Surprasil P20.
4.4.Stress depression due to SiOH generation
As already mentioned, SiOH generation depressed the stress and the stress increased with increasing SiSi concentration over a threshold, 7×10¹⁷ and 1×1018cm-3 for GE214 and Suprasil P20, respectively. Fig.15 shows the stress depression effect due to SiOH generation. The relation was evaluated by a second order regression fit to the data for GE214. The correlation coefficient was 0.87. In addition, the plots for Suprasil P20 are also on this figure. Although GE214 and Suprasil P20 are different types of silica with respect to impurities and optical properites as well as manufacturing processes, the data fit the same curve quite well. Therefore, the amount of SiSi generated affected the degree of the stress generation independently of the type of silica in this case. The generation of SiOH or pair of SiOH and SiH depressed the rate at which the stress increased. The concenration of SiH and SiOH which produced the maximum depression of the stress was 4×1019cm-3. Even for GE 214 which is strained easier by Xe plasma light, if the SiOH concenration was about 5×1019cm-3 near the surface, the stress generation ratio was decreased to the same degree as in suprasil P20.
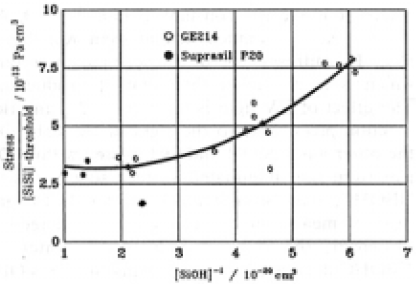
Fig.15. Stress depression effect due to SiOH generation. A second order regression fit was made on the plots.
4.5. Defect generation prosess
It was found from results of gas release measurements (Section 3.4) that H2 gas release from unillminated Suprasil P20 was due to molecular H2 diffusing out and SiOH was the product resulting from the reaction between v-SiO2 and H2 initially contained in the plate and/or H2 mixed in Xe gas during illumination. The contribution of H2 in Xe was recognized in the increasing amount of H2 released form illuminated specimens. As little as 1×10¹⁵ molecules of O2 gas release was, in fact, detected for Ge214 No.10. The amount of O2 released was less than that expected form the number of SiSi bonds generated. The increased optical density at 164 nm after illumination was 0.94 mm-1 and decreased to 0.25mm-1 after gas release measurements. This absorption band due to SiSi bonds was not eliminated completely by heating under vacuum at 1000°C for 2h.
The concentrations of SiOH and SiH were almost equal in illuminated GE214. SiOH is also produced through a process reacting SiO2 with H2O, but in this case SiOH is a product with H2, as seen from the H2 release data. The reaction between silica and H2 is written as
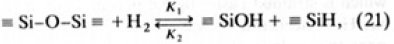
where K1, K2 are rate constants of first and second order reaction, respectively. Van der steen [29] reported K1, K2 for silica prepared by melting milled Brazilian Rock crystals:
where R is the gas constant (J mol-1 K-1). At T=873 K, K1,is much smaller than K2 ; therefore, H2 diffuses out of a specimen at a rate which is much higher than that of production. The effect of UV light is to increase K1 and the reaction proceeding to the right of Eq. (21). On the other hand, SiOH and SiH existed within 100μm from the illuminated surface together with NBOHC, and also SiSi and E' center. In the gas release measurement, O2 gas was detected. Moreover, the concentration of E' center or NBOHC decreased with increasing SiH or SiOH respectively (see Fig.9).
On the basis of these facts, the following photo chemical reactions taking place during illumination are proposed:
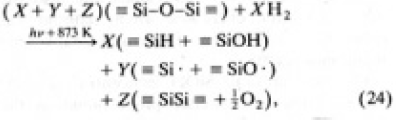
where X, Y and Z represent the relative concentration of each of product and X≈3Z≈100Y It is deduced that X and Z were stored in the specimen during illumination, but iY saturated at a certain value. During illumination, we speculate that Y was one or two order of magnitude higher than that detected after illumination at room temperature[30] and most of the Y products vanished during cooling. The disappearance of the Y product seems to be a reason why the concentrations of E' and NBOH centers were almost constant with increase in the fluence.
According to the result of EPR measurement,the concentration of E' centers was approximately one order of magnitude larger than that of NBOHCs; therefore, Eq.(24) is not strictly correct.The fact that E' centers existed throughout a specimen and the NBOHC was found only within about 200µm of the surface accounts for the error in Eq.(24). According to the article by Arai et al.[31] , one of the E' center generation processed reported is from ionization of the species causing an optical absorption band at 245 nm. In principle, this species is the SiSi homo band. In case of illumination with Xe plasma light, the 245 nm band was bleached, which could be the cause of the higher concentrations of E' centers relative to NBOHC.
The concentrations of SiSi bands are 10-3-10-4 compared with the number of SiO2 molecular units; hence,the mechanisms by which such a small concentration generates the observed stress in unknown.
5. Summary
- We have shown that the following.
- (1) Light from a Xe arc lamp increases densities of silica by ~1% to a depth of≦ 200µm.
- (2) The starain energy increases proportionally to the energy fluence of Xe plasma light.
- (3) SiSi homo bond (order of 1019cm-3) and SiOH and/or SiH (order of 1018cm-3) are gencrated as main defects in the densifized portion adove this threshold.
- (4) Measurable stress is defected at a SiSi homobond concentration of ~7×1017cm-3 and crrelated with concentrations of SiSi bonds which are produced.
- (5) SiSi homo bond is produced by Xe2 emission from the arc (158.5-190nm) and the wavelengths contributing to the generation depend upon the type of silica.
- (6) H2 gases react with the silica via the generation of E´and NBOH centers producing SiOH and SiH.
- (7) SiOH and SiH generation give optiocally clear bulb in the UV region by diminishing the absorption due to E´and NBOH centers producing SiOH and SiH.
- (8) The stress generated is effectively suppresssed by SiOH and/or SiH generation when the concentrarion is about 4×1019cm-3.
The authors gratefully thank Professor Hideo Hosono, Tokyo Insitutute of Technology, for EPR measurements and fruitful discussion.The assistance of Professor R.A.Weeks, Vanderbilt University,in editing this manuscript is gratefully acknowledged.
関連製品
論文を探す

ウシオ社員の学会発表論文、学会誌・専門誌投稿論文、慶応義塾大学の松本 智先生による専門誌投稿論文をご紹介しています。
(1996年09月)