光技術情報誌「ライトエッジ」No.20(2000年12月発行)
99International Conference
Journal fo Korean Association of Crystal Growth
Vol. 9, No.4(1999) 424-431
('99年6月)
TSSG-pulling of sillenite Bi12TiO20 for EOS application
Shintaro Miyazawa
USHIO Research Institute of Technology (URIT) Inc. USHIO INC. Shizuoka 412-0038, Japan
(Received June 9, 1999)
Abstract
The reproducibility of successive growth of Bi12Tio20 (BTO) single crystals using a top-seeded solution growth (TSSG) pulling method was evalutated by measuring the lattice constants and their standard deviations. A substantial phase diagram in the region close to the stoichiometric BTO was established experimentally for this purpose, and the existence of a retrograde solid solution close to a BTO was clarified. It was emphasized that a starting solution, with a 10.0~10.1 mol% TiO2 concentraion, results in large single crystals with a highly homogeneous lattice constant of within±}1×10⁻⁴Å, when the solidifed fraction of the grown crystal is less than about 45%. A warelength dispersion of refractive index and measured for the first time, and it was verified that the refractive index of BTO is larger than that of BSO (Bi12SiO20), allowing the voltage sensitivity of EOS higher than the case with BSO as a probe head.
1. Introduction
A high-impedance electro-optic sampling (EOS) prober has aready become a standard tool in measuring the ultrafast eletrical singnals in printed circuits and multi-chip modules now being applied to mobile communications and data transmission [1, 2]. More recently, a novel handy-tape, highimpedance probing system consisting of an electrooptic 12SiO20 (BSO) crystal was developed for measuring multi-GHz signals [3].
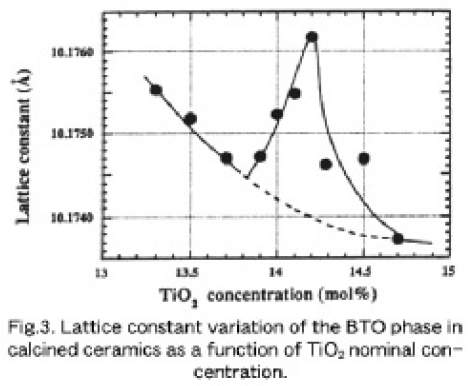
However, its voltage sensitivity must be further improved in practices. The shot-noiselimited expression for the minimum detectable voltage Vmin. in the EOS technique [1] is expressed as
where VΠ is the half-wave voltage of the electro-optic crystal, q is electron, charge and iavg is the average photocurrent of the system's photodetector. Because VΠ is inversely proportional to n3r, the product of electro-optic constant r and refractive index n, the sensitivity can be increased by using an electro-optic crystal with a larger r41 and n than those of a BSO crystal.
Then, we tuned our attention to Bi12Tio20 (BTO) single crystals for use in an EOS probe head, because they have the largest electro-optic constants r41 among sillenites so far reported [4], although the precise value of their refractive index is unknown.
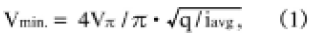
According to the phase diagram of the Bi2O3-TiO2 binary system reported by Bruton [5], BTO melts incongruently at 873~875°C, decomposing into liquid and Bi4Ti3O12 associated with a peritectic reaction and the single phase BTO does not have any solid solution. Therefore, BTO single crystals are usually grown using the top-seeded solution growth (TSSG) pulling method from Bi2O3-rich solutions of less than about 12 mol% TiO2, far from the stoichiometric BTO (14.286 mol% TiO2 composition) [6, 7, 8, 9, 10]. However, a standard method for growing BTO single crystals has not yet been established.
This parper primarily discusses a phse relation in a Bi2O3-rich region from the stoichiometric composition and BTO single crystal grown using the TSSG method based on a substantial phase diagram. The phase diagram reported earlier [5] was renewed experimentally. Moreover, a wavelength dispersion of the refractive index was measured for the first time and sensitivity improvement in the EOS system, using a BTO crystal, is discussed briefly in comparioson with the case of a BSO.
2. Experimental
Ultra-high purity raw materials of Bi2O3 (99.9995 %) and TiO2 (99.995 %) were used throughout this work. In drawing a substantial phase diagram close to the stoichiometric BTO (14.286 mol% TiO2), a differential thermal analysis (DTA) of binary compounds with different TiO2 concentration close to the stoichiometric composition was carried out in order to reexamine the periotectic reaction and eutectic temperatures. Heating and cooling rates were 1°C /min. To clarify the periotectic composition experimentally, TSSG pulling was carried out with solutions that varied between 10.25 and 11.25 mol% TiO2.
To examine the existence of a solid solution range close to the stoichiometric BTO phase, mixed binary compounds with 13.3~ 14.7 mol% TiO2 were calcined at 830±5°Cfor 20 hr in air, and the lattice constants of the BTO phase in each ceramic were calcined 830±5°Cfor 20 hr in air, and the lattice constants of the BTO phase in each ceramic were evaluated. The calcination temperature of the ceramics was very close to the determined eutectic temperature described hereafter, resulting in sufficient precipitation of the BTO phase. They were analyzed by X-ray powder diffractometry using α1 at room temperature with Si powder as a reference and were calculated by means of the Nelson-Riley approximation method using all peaks indexed to the cubic sillenite BTO. The measurements were carried out more than 3 times for each compound, and measurement accuracy was estimated to be less than 1×10⁻⁴.
Single crystals of BTO were grown using a TSSG technique from off-stoichimetric solutions with stating compositions of 4.0, 5.0, 6.5, 8.0, 9.0, and 10.25 mol% TiO2. Growth apparatus has already been reported elsewhere[9], and only the essential growth conditions are briefly given here:~0.25 mm/hr puling rate, 35~45 rpm crystal rotation rate, oxygen atmosphere (about 2l/mim flow) during the pulling, and about 350 gr total amount charged in a 40 cc Pt crucible. In this study, the pulling axis was fixed to the [100] direction. Three to five single crystals, typically 15~20 mm in diameter and about 25 mm in length, typically weighting about~40 gr, were grown in succession from one starting solution. For successive growth from the initial solution, calcined stoichiometric BTO ceramics, equal in weight to that of the previously grown crystal, were added to the residual solution. The grown crystals were also characterized by then lattic constants estimated with X-ray powder diffractometry and the Nelson-Riley approximation method in the same manner. Samples were prepared form the first crystallized part immediately below the seed crystal. Further growth experiments of relatively long single crystals were carried out with 9.0 and 10.0 mol% TiO2 solutions to examine the change in lattice constants along the crystal. The change is discussed using the substantial phase diagram renewed here.
An accurate refractive index of a BTO has not been reported so far, so the wavelength dispersion of the refractive index was measured by means of the minimum deviation method using a prism.
3. Results and discussion
3.1. Phase diagram
Figure 1 (a) shows the substantial phase diagram drawn by the experimental results described below. On DTA curves of ceramics with different mol% TiO2, strong exothermic and endothermic peaks were obtained, while peaks corresponding to the liquidus line were weak. In Fig. 1 (a), the peritectic and eutectic reaction temperatures observed on heating and cooling curves were plotted against different TiO2 concentrations. The eutectic and the peritectic temperatures were determined to be 823±3°Cand 855Å}2 ÅK C, respectively Surprisingly, the temperatures corresponding to the eutectic reaction were higher and the temperatures corresponding to the peritectic reaction were lower than those reported by Bruton [5] as shown in Fig. 1 (b).
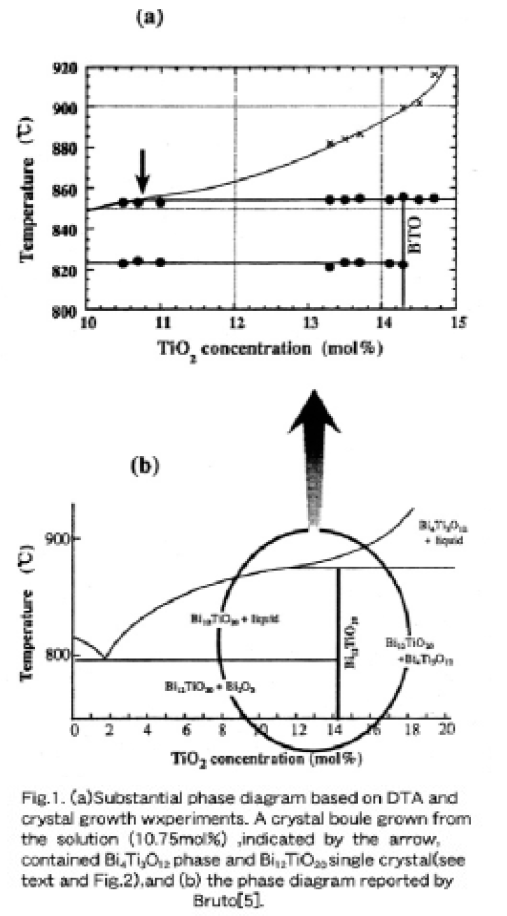
Hereafter, we focus on a TiO2-poorer region than the stoichiometric BTO, because the single crystals are grown only from hypo-peritectic solutions using the TSSG pulling. According to Bruton's phase diagram shown in Fig. 1 (b), starting solutions with a TiO2 concentration of lower than the peritectic composition (~12 mol%) provide the BTO single phase. Since clear peaks corresponding to the liquidus temperature close to the periotectic composition could not be obtained on DTA curves, TSSG pulling was carried out with 10.25 to 11.25 mol% TiO2 solutions in order to verify the peritectic compositon. Polycrystalline boules consisting of Bi2O3, BTO and Bi4Ti3O12 were obtained from 11.00 and 11.25 mol% TiO2 solutions, while single phase BTO crystals were obtained from 10.25 and 10.50 mol% TiO2 solutions. As shown in Fig. 2 (a), the boule grown from a 10.75 mol% TiO2 solution indicated by the arrow in Fig. 1 (a) looked polycrystalline (dominantly Bi4Ti3O12), but the inside more than 95 % of the lower half part shown in (b) was recognized to be a monocrystalline BTO phase with a lattice constant of 10.17439Å. This means that the first crystallied part beneath the sed crystal was of the lamellae-type Bi4Ti3O12 phasee and the BTO single phase crystallization after the while resulted from a gradual change in solution composition passing the peritectic composition along the liquidus curve. Therefore, we emphasize that the substantial peritectic composition must lie close to a 10.75 mol% TiO2 concentration or less to some degree.
3.2. Lattice constant of the Bi12TiO20 phase in ceramics
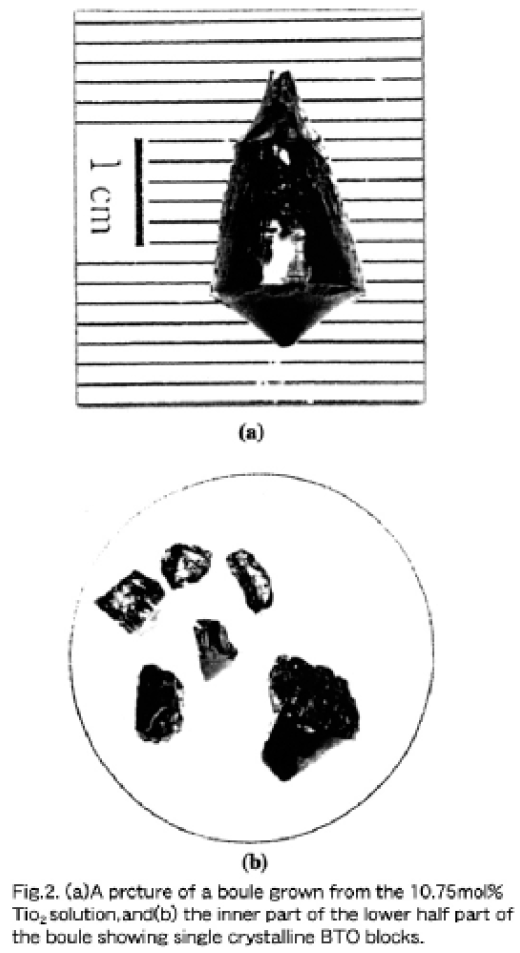
Figure 3 shows the lattice constants of the BTO phase in the calcined ceramics as a funciton of TiO2 concentration in nominal mol%, redrawn from our early work [11]. The measurements were carried out more than 3 times for each sample. X-ray diffraction patterns of samples with a TiO2 of less than the stoichiometric 14.286 mol% TiO2 (hypo-peritectic region) showed the existence of α-Bi2O3 phase, while those of the samples exceeding 14.286 mol% TiO2 (hyper-peritectic region) included relatively small signals of Bi4Ti3O12. As TiO2 concentration increased from 13.3 mol% the lattice constant decreased monotonously and seemed to reach a minimum at around 13.80. 13.85 mol% TiO2. From this minimum, the lattice constant increased rapidly to about a maximum value at around 14.2 mol% TiO2 and again decreased for 14.7 mol% TiO2 through the stoichiometric compositon (14.286 mol% TiO2). This strongly indicates the existence of a non-stoichiometric solid solution range. Besides, we noticed that the lattic constant of the stoichiometric compound was necessarily smaller than that of the BTO phase in the 14.2 mol% TiO2 compound. Such a nonlinear relationship between the solution composition and the lattic constant of crystals was also discussed in 12SiO20(BSO) [12], where the composition of a crystal grown from x~11.6 melt composition in the formula of BixSiO1.5x+2 showed the minimum [13].
It can be readily supposed that there exist a solid solution in the hypo-peritectic region. Bruton's phase diagram (shown in Fig1 (b)) indicates that a BTO crystallizes as the primary pahse from a Bi2O3- rich solution in the hypo-peritectic region and the crystal composition is independent of the solution composition. However, a rapid icrease of lattice constants in the hypo-peritectic region suggests that the stoichiometry of the primarily crystalized BTO must be influenced by a starting solution composition. Figure 4 (a) shows the calculated lattice constants of BTO single crystals grown in succession from each starting solution of 4.0, 5.0, 6.5, 8.0, 9.0 and 10.25 mol% TiO2, where one point data of the crystals grown from 10.10 and 10.75 mol% TiO2 (see Section 3.1) solutions are added. The lattice constant decreased monotonously with an increased TiO2 concentration, but those of crystal grown from a 9.0 mol% TiO2 solution show the minimum. Noticeably, the lattice constants of crystals grown from 8.0 and 10.25 mol% TiO2 solutions are larger than that grown from a 9.0 mol% TiO2 solution and are almost the same. This means that the crystal compositions grown from 8 and 10.25 mol% TiO2 solutions must be very close to each other, and this strongly suggests that a solidus curve must be retrograde, regardless of point defects such as BiTi3+- antisites [14], vacancies and/or oxygen deficiency.
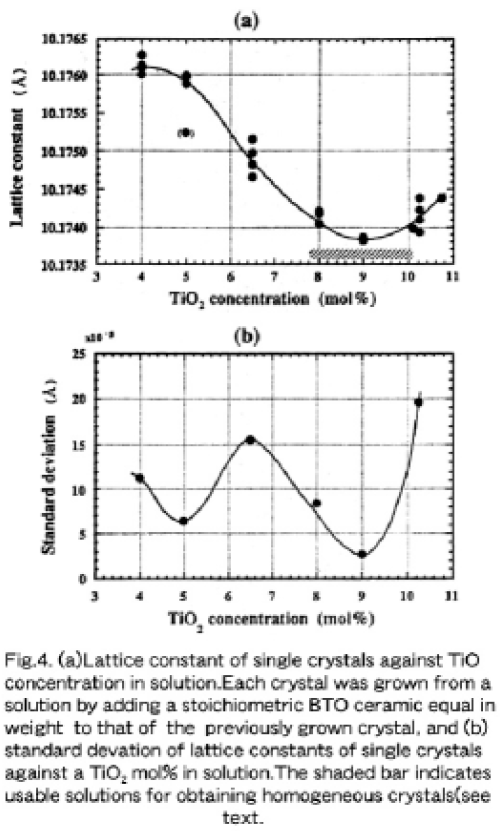
3.3. Retrograde phase relation of the solid solution
FThe standard deviation of calculated lattice constants of the single crystals grown from each solution was taken into account in drawing the solidus line of a solid solutions. This is because the composition of the primarily crystallized phase corresponds predominantly to the solidus line in phase equilibrium. As shown in Fig. 4 (b), the deviation of lattice constants of the crystals grown from the 9.0 mol% TiO2 solution showed a minimum value of 2.62×10⁻⁵Å. This means that the corresponding solidus line changes its slope (dT/dCs, where T is the temperature and Cs is the TiO2 concentration) from a positive to a negative one. On the other hand, the lattice constant deviation of other crystals became larger to some degree, which implies a gentole sope of the solidus line, especially that from a 10.25 mol% TiO2 is relatively large. Therefore, it can be said that the crystal composition grown from a 9.0 mol% TiO2 solution must correspond to the turning point of a retrograde solidus curve, even when the starting solution composition changes to some degree by the successive adding of a stoichiometric compund equal in wieight to that of the previously grown crystal. This proves the minimum deviation of lattice constants of the crystals grown from the 9.0 molL% TiO2 solution.
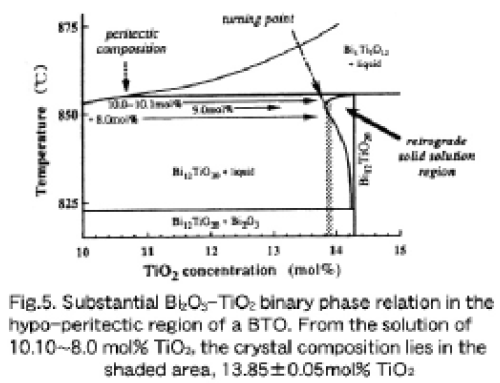
Together with experimental results and the expected consideraitons described above, it is possible to draw the relevant part of the phase diagram in the hypo-peritectic region close to the stoichiometric composition of a BTO (14.286 mol% TiO2). Figure 5 shows a renewed, substantial phase diagram with a plausible retrograde solid solution close to the stoichiometric BTO. We can consider that the turning point of the retrograde solidus curve lies around 13.80~13.85 mol% TiO2, because the minimum value in Fig. 3 lies around 13.80. 13.85 mol% TiO2. This retrograde characteristic can explain qualitatively the lattice constant variaiton shown in Fig. 3, and is very similar to that in the solid solution regime of congruently melting 12SiO20 [12], and will be clarified in Chapter 4.
As is expected from Figs. 4 and 5, we can clearly understand that the standard deviation of the lattice constants of crystals grown from a 9.0 mol% TiO2 solution had the lowest (2.67×10⁻⁵Å. while those grown from lower TiO2 mol% solutions were larger than 5x× 10-5Å. This means that a very high reproductivility of the crystal composition from the 9 mol% TiO2 solution is to be expected. We achieved reproducible growth of high quality BTO single crystals (relatively the same lattice constant) by adding stoichiometric ceramics equal in weight to that of the previously grown crystal [15].
4. Growth of long single crystals
As was discussed in Section 3.3, an about 9.0 mol% TiO2 solution was determined to be the best starting solution for the reproducible growth of relatively small single crystals, resulting in almost the same lattice constant. In the case of TSSG pulling, the starting solution composition changes gradually along the liquidus line as a crystal grows up. Then, the variation of the lattice constant along the crystal length was investigated by growning long single crystals.
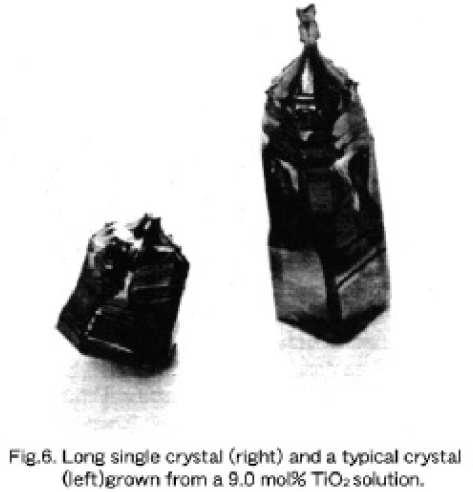
First, an about 55 mm long and 147.7 gr weighed single crystal was grown from a fresh 9.0 mol% TiO2 solution, as shown in Fig. 6. Lattice constants at the top and bottom were measured to be 10.17387 and 10.17470Å, respectively. The lattice constant of the primarily crystallized top corresponds well to that of crystals grown for the 9.0 mol% TiO2 solution and that of the bottom is close to that of a crystal grown from a 6.7 mol% TiO2 solution, as in deduced from Fig. 4 (a). This tendency accords fairly well with the retrograde solidus curve; the TiO2 concentration in the solution becomes gradually poorer along the liquidus line as the crystal grows up, and the corresponds TiO2 concentration in the crystal becomes richer along the solidus line, resulting in an increase in the lattice constant, as shown in Fig. 4 (a).
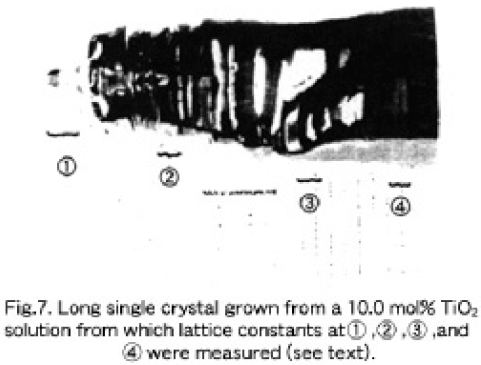
Second, an about 53 mm long and 123.9 gr weighed single crystal was grown from a 10.0 mol% solution. Figure 7 shows the as-grown crystal, where the lattice constants ① the first crystallized parts, ② the upper part of the boule, ③ the lower part of the boule, and ④ the bottom part were evaluated to be 10.17417, 10.17390, 10.17455, and 10.17525Å, respectively. This change in lattice constants along the growth axis follows the retrograde solidus line shown in Fig. 5. reasonably well. The lattice constant of the parts ①, ②, ③ and ④ correspond to crystals grown from 10.00. 10.1 mol%,~9.8 or 8.6 mol%,~7.1 mol%, and~ 6.1 moll% TiO2 solutions, respecively, as are deduced from Fig. 4 (a).
The single crystal grown from the 9.0 mol% TiO2 solution had a solidified fraction of 65.8%, since a total amount of solution charged into a crucible was 373.72 gr from which a BTO crystallizes 224.3 gr in weight. On the other hand, the crystal grown from the 10.0 mol% TiO2 solution had a solidified fraction of 49.7%, since the total amount of solution was 370.4 gr from which a BTO crystallizes 249.2 gr in weight. In referring to Fig. 4, single crystals grown from solutions with TiO2 concentration of between~7.5 and~10.0 mol% have a lattice constant deviation of less than~1.0×10⁻⁴Å. Consequently, it can be said that a starting solution with a 10.0~10.10 mol% TiO2 is very practical for growing relatively homogeneous single crystals whose lattice constants are within± 1×10⁻⁴Å over the whole crystal boule, as indicated by the shadow bar in Fig. 5, when a solidified fraction is at least less than 45 % for this purpose.
5. Refractive index measurement
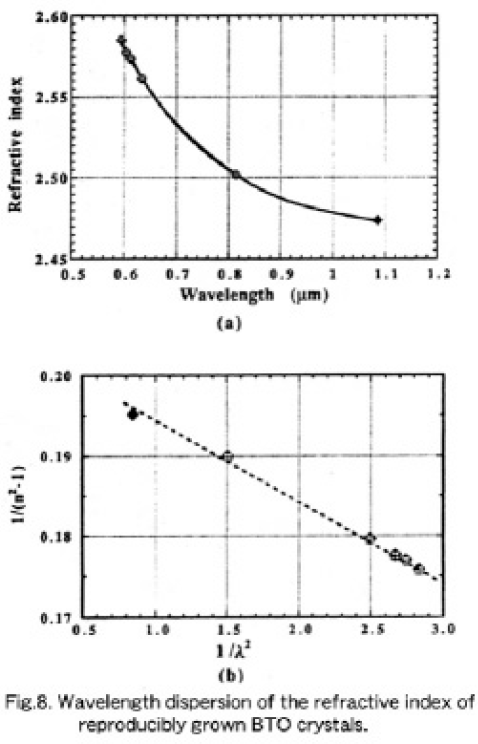
Figure 8 shows wavelength dispersion of the refractive index of the thus grown crystals. This is the first result on the refractive index of a BTO single crystal. The dispersion fits well with the single-term Sell-meier's relation

where S0 is the average oscillator strength, and λ0 is the average oscillator position. Using a straight-forward approximation, S0 and λ0 were determined to be 94.1265 and 0.227135, respectively. We can then express Eq. (1) as

As far as we know, this is the first report of the wavelength dependence of the refractive index of a BTO single crystal. The value is larger than that of a BSO [16], and then the product in n3r41(λ= 632.8 nm) of a BTO was estimated to be more than 1.3 times larger than that of a BSO, although the wavelength dependence of the electro-optic constant is unknown. Knowing the correct refractive index is very important because of its use in preparing antireflection coating and high-reflective coating mirrors on either end of an EOS chip.
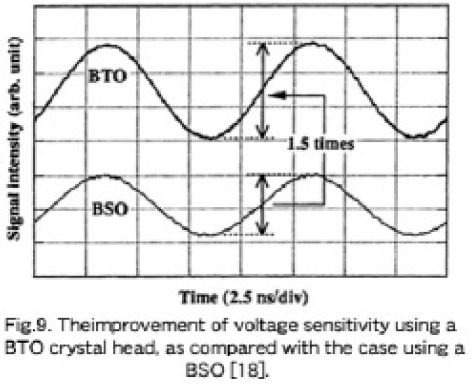
The voltage sensitivity was measured with a 1 V, 100 MHz sinusoidal signal on a standard micro-strip line, and a handy-type EOS system with a probe head made of a BTO crystal has 1.5 times higher voltage sensitivity than one made with a BSO crystal [3, 17]. Figure 9 shows the measured result illustrating and improvement in voltage sensitivity of more than 1.5 time higher than that of a BSO head with precise manipulation. Since the shot-noise-limited expression for a minimum detectable voltage Vmin. is given by Eq. (1) where VΠ is inversely proportional to n3r, the increase in sensitivity can be analyzed semiquantitively as follows, even though there is a lack of accurate values; r41 of a BTO is 1.15ε1.4 times larger [4], n is about 1.04 times and λ is about 0.8 times larger than those of a BSO, that yields at least a~1.5 times larger n3r41/É√ than that of a BSO. So, a 1.5 times improvement in voltage sensitivity shown in Fig. 9 is reasonable. In this advanced and practical system, the use of a BTO crystal as a probe head was one of the key issues inevitable for improvement of voltage sensitivity [18]. So the reproducible growth of the single crystal described in this paper is very effective for practical uses as an EOS probe head, and is also very useful in photorefractive aplications.
7. Summary
For practical application of a sillenite Bi12Tio20(BTO) crystal to a handy-type, high-impedance electrooptic sampling probe system, we renewed the phase diagram of the hypoeutectic Bi2O3-TiO2 region and characterized BTO single crystals measuring the lattice constants of crystals gown from hypoperitectic solutions by using the TSSG method. This study strongly proved the existance of a solid solution region with a retrograde solidus curve whose turing point lies around 13.80~13.85 mol% TiO2, corresponding to an about 9.0 mol% TiO2 solution. From a 9.0 mol% TiO2 solution, BTO single crystals with a minimum lattice constant deviation of less than 3×10⁻⁵Å could be reproducibly grown. A starting solution with a 10.0~10.1 mol% TiO2 concentration and the solidified fraction of the crystal of less than about 45 % will result in a relatively homogeneous single crystal whose lattice constant 'deviation is less than 1×10⁻⁴Å.
The wavelength dispersion of the refractive index was measured for the first time, and the product n3r of a BTO was estimated to be about 1.3 times larger than that of BSO. The improvement in voltage sensitivity in the handy-type EOS system by replacing a BSO with a BTO for a probe head was basically associated with this increase in n3r/ε.
This paper presented the first experimental results showing the existence of a retrograde solid solution of incongruently melting BTO, which is representative of the peritectic decomposition binary system. Because the stoichiometry of these crystals should be poorer in TiO2 concentration than in stoichiometric BTO ones, we are now investigating the crystal chemicstry of off-stoichiometric BTO single crystals grown from different starting solutions.
Acknowledgments
Most of this work was done, when the author had been in NTT System Electronics Labs. till March, 1998. The author wishes to expres his thanks to N.Suzuki (USHIO Research Institute of Technology Inc.) and T. Tabata (NTT Advanced Technology Corp.) for their crystal growth experiments and lattice constant measurements, and to Drs. M. Sinagawa and T. Nagatsuma for their EOS measurements.
光技術情報誌「ライトエッジ」No.20(2000年12月発行)
The 1st Asian Conference on Crystal Growth and Crystal
(2000年8月~9月)
TSSG OF CsLIB6O10 AND CsB3O5; THEIR SIMILARITY AND DISSIMILARITY
Y. Kagebayashi a)*, Y. Morimoto a), S. Miyazawa a), Y. Mori b) and T. Sasaki b)
a) R & D Center-Gotenba Laboratory, USHIO Inc.,
1-90 Komakado, Gotenba, Shizuoka 412-0038, Japan
b) Department of Electrical Engineering, Osaka University
2-1 Yamadaoka, Suita, Osaka 565-0871, Japan
All solid-state lasers emitting at ultraviolet (UV) wavelength range using nonlinear optical crystal are very attractive in industrial applicaitons. Since there have been reported many nonlinear optical crystals so far, the most practical candidates generating UV light are borate series crystals such as β-BaB2O4 [1, 2], LiB3O5 (LBO) [3], Li2B4O7 [4], CsB3O2 (CBO) [5], KBe2BO3F2 [6], SrBe2BO7 [6] and CsLiB6O10 (CLBO) [7, 8]. These borate crystals have an UV absorption edge shorter than 200 nm and also phase-matching angles for UV generations of Nd: YAG laser. They are basiclally composed of B-O anionic groups [9], such as (BO3)3-, (BO4)5-, (B3O6)3-, (B3O7)5-, and (B4O5(OH)4)-. Among them, CLBO is a new compound [10] lied in the LiB3O5-CsB3O5 pseudo-binary system, and LBO, CBO and CLBO are composed of (B3O7)5- anionic group. CLBO belongs to a tetragonal system while LBO and CBO belong to an orthorhombic system. CBO and CLBO melt congruently and their melting temperatures are very close to each other (848°C and 842°C, respectively), whereas LBO melts incongruently. In this report, similar and dissimilar aspects in single crystal growth of CLBO and CBO are discussed.
Both crystals were easy to grow from~2 mol% B2O3-poorer melts than their stoichiometric compositon. Experimentally, as-grown crystal habits of CLBO were identified to be {101}, while those of CBO were {101} and {011}. Growth conditions; seed rotation rate, cooling rate and seed orientation, were varied and inclusions and light scattering in each crystal were investigated.
Table 1 summarizes growth conditions and experimental results on CLBO and CBO. Distinct inclusions were found in CBO grown at the seed rotation rate slower than 30 rpm, but not for 60 rpm. The inclusions wer identified to be Cs2O by X-ray powder diffractometry. Since the inclusions depended on the rate, a strring effect in the melt should affect to trap them. On the other hand, CLBO did not have any inclusions at any rotation rate of our experiments (15~30 rpm). One of the reasons for this difference between CLBO and CBO may be related to the shape of growing crystal. <100>-grown CLBO was lozenge in shape, which accelerates a stirring effect in a melt during the growht, while <100>-grown CBO was relatively isotropic in shape. In <100>-CBO growth, the growth rate of (101) was approximately 2.8 times faster than that of (011). As the result, <100>-grown CBO became rectangular in shape. This propeller-like shape, which could be formed in case of <100>-growth as well, should effectively stir in a melt more than <100>-grown CBO.
Light scattering was observed in all grown crystals with a He-Ne laser (0.6328µm), except for the CLBO grown by a cooling rate of 0.1°C/day during the growth. Scattering centers were investigate by TEM observation but any trace of precipitates was not recognized in CLBO crystal. Therefore, light scattering must be caused by very fine fluctuations of constituents, which produces fluctuations of dipoles. The cooling rate less than 0.1°C/day seems to offer an ordering of the constituents in CLBO. This means that the degree of supersaturation was well-controlled in stable in front of the crystal/melt interface during the growth. The same phenomenon would be expected in CBO growth, where the cooling rate will be set at less than 0.1°C/day to grow crystals without scattering centers.
The growth conditions without includitions and light scattering centers in CLBO growth can apply in CBO growth. Therefore the result of crystal grown would be feedback to each other in the case of CLBO and CBO growth.
論文を探す
医療分野をはじめとした学会発表、プロジェクタ用光源を含む専門誌投稿の技術論文などをご紹介します。
(2000年12月)