光技術情報誌「ライトエッジ」No.42(2015年05月発行)
大学研究室を訪ねて Campus Lab㉗
遺伝子発現を利用した生物機能開発
九州大学大学院農学研究院 生命機能科学部門 遺伝子制御学分野
教授 久原 哲 先生
九大百年、躍進百大、新たな百年を目指して
―九州大学
九州大学は、11の学部をはじめ、17の学府と16の研究院を置いた大学院、特色ある附置研究所、専門職大学院を数多く有し、西日本を代表する基幹総合大学である。
その前身は、1903年に京都帝国大学の分科大学として福岡に開設された、附属医院をもつ福岡医科大学である。1911年、この福岡医科大学と新設の工科大学からなる九州帝国大学が創設され、1919年に医科大学は医学部に、工科大学は工学部となり、同時に農学部が開設。その後も法文学部や理学部の新設、旧制高等学校や専門学校の合併を行い、1949年に新制の国立九州大学となる。
九州大学はその後も時代の要請に呼応し、学部の改組・新設・増設、他大学との統合などを推進し、“アジアに開かれた「知」の世界的拠点”と呼ぶにふさわしい規模と陣容を備え、広く社会に貢献し続けている。
九州大学は、その「教育憲章」や「学術憲章」に示されているように、教育においては、世界の人々から支持される高等教育を推進し、世界において指導的な役割を果たし活躍する人材を輩出し、世界の発展に貢献することを目指している。また学術研究においては、人類が長きにわたって遂行してきた真理の探究と、そこに結実した人間的叡智を尊び、これを将来に伝えていくとともに新しい展望を開き、世界に誇り得る先進的な知的成果を生み出していくことを使命としている。
▼ 九州大学 箱崎キャンパス: 地区内は理系キャンパスと文系キャンパスに分かれている。福岡空港16番滑走路に着陸する直前の飛行機が真上を通過する。理系キャンパスには旧大学本部や旧法文学部棟など倉田謙の手により大正時代に建てられた古い建物がいくつか残っている。九州大学の赤本の表紙にある建物はこのキャンパスにある工学部本館でやはり倉田の設計で1930年(昭和5年)に竣工した。なおこの地区の学生寮としては男子寮の松原寮、女子寮の貝塚寮がある。2019年(平成31年)度移転完了予定。

遺伝子と遺伝子機能の制御と
バイオインフォマティクス―
農学研究院 生命機能科学部門 遺伝子制御学分野 久原研究室
私達は、生物体そのものを相手にした試験管を振る実験(分子生物学や細胞生物学の実験)と様々な情報をコンピュータで論理的に処理する解析(バイオインフォマティクス)を行って、その両者から得られる情報を組み合わせて、複雑な生命現象の解明を目指しています。また、微生物からヒトまでの様々な生物を対象とし、基礎から応用までの広範囲のテーマを取り扱っており、遺伝子と遺伝子機能の制御の観点から研究を進めています。
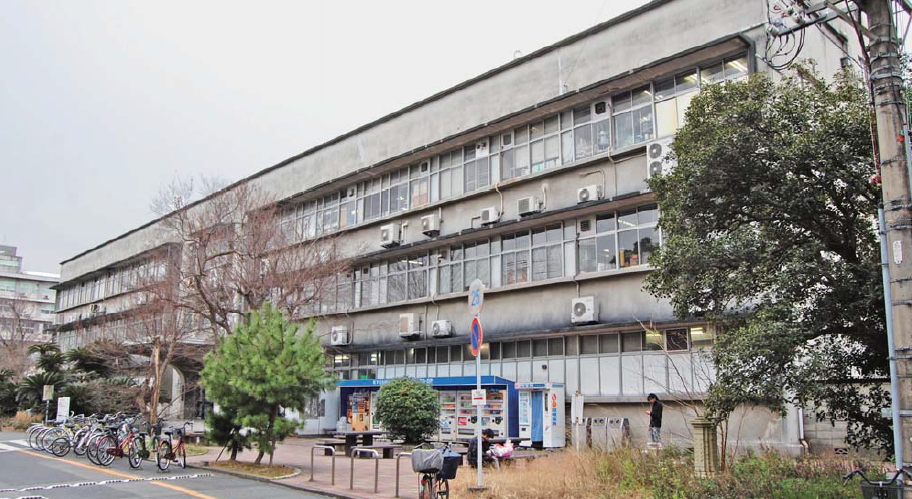
▲ 久原研究室のある農学部6号館
研究領域
主な研究テーマ
DNA microarrayデータ解析を基盤とした研究
遺伝子の発現制御の基本機構の解明
- ・遺伝子制御のネットワーク構築
- ・幹細胞分化の遺伝子制御
応用研究
- ・がんの診断用遺伝子探索
- ・イチゴの育種用遺伝子マーカー遺伝子の探索
- ・土壌・海域環境解析用のマイクロアレイの開発と環境評価
バイオインフォマティクスを基盤とした研究
- ・タンパク質の立体構造解析
- ・遺伝子発現制御機構のコンピュータによる解析手法の開発
- ・ゲノム配列解析(まぐろゲノムプロジェクト)
研究紹介(研究の一部を紹介します)
DNA microarrayデータ解析を基盤とした研究
マイクロアレイ法は、ガラスなどの基盤上に数千から数百万種類のDNAを固定し、ハイブリダイゼーションの原理を利用して解析することにより、遺伝子の存在、動態、変異、発現状態などを測定する方法です。これにより、生物の持つ全ての遺伝子の動的挙動を一回の操作によって効率的、また、定量的に計測することが可能となります。この結果を解析することにより、様々な生命現象(発生、分化、増殖、癌化、老化など)における遺伝子発現の制御回路を作成することが可能であり、ひいては、医学分野、物質生産分野での効果的な応用へと広がる 第一歩となると考えられます。
現在では、様々なメーカーが、Microarray chipを販売していますが、遺伝子制御学分野では、独自にMicroarray chipの作成をできるシステムを開発してきました。これにより、低コストで解析を行うことができます。
当研究室では、この技術とコンピューターによる解析システムを組み合わせて、上述したような基礎的な生物現象の解明、さらに、がん研究や農産物品種育成などの応用研究を実施しています。
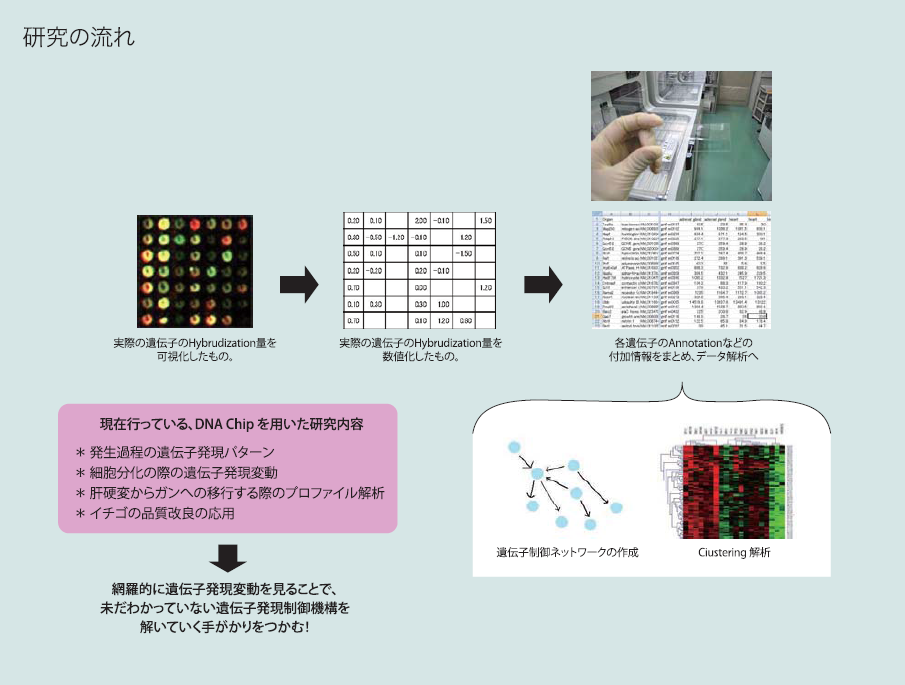
▲ 遺伝子制御ネットワークを解く
マイクロアレイ解析を用いたeDNA情報の迅速解析システムの開発と利用
近年、土壌、海域などの自然環境や皮膚、腸管内などの環境中に生育する生物群(微生物叢)のDNAを解析するメタゲノム解析が行われています。本研究室では、微生物叢にどのような種類の微生物が生息しているかを調べるためのDNAチップを開発し、さらに最近では次世代シーケンサーを利用したメタゲノム解析によって各種環境(土壌、海域、腸管内など)に生息する微生物群を同定し、微生物叢及びその性質と環境との関係を明らかにすることを目的とした研究を推進しています。この研究は、様々な応用面が期待されていますが、主に、農産物と土壌環境、海洋生物と海域環境などに焦点を当てた研究を進めています。
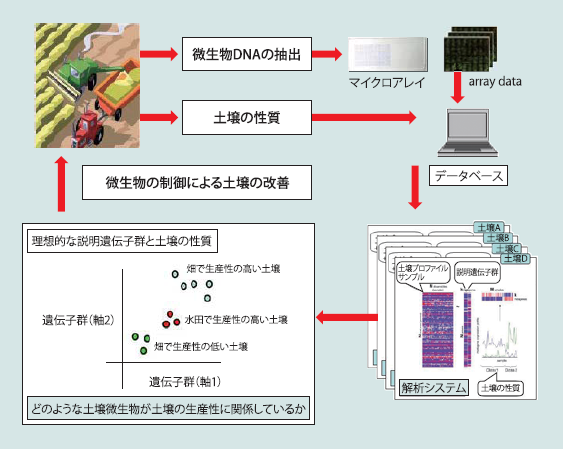
▲ 応用例:環境を微生物で捉える
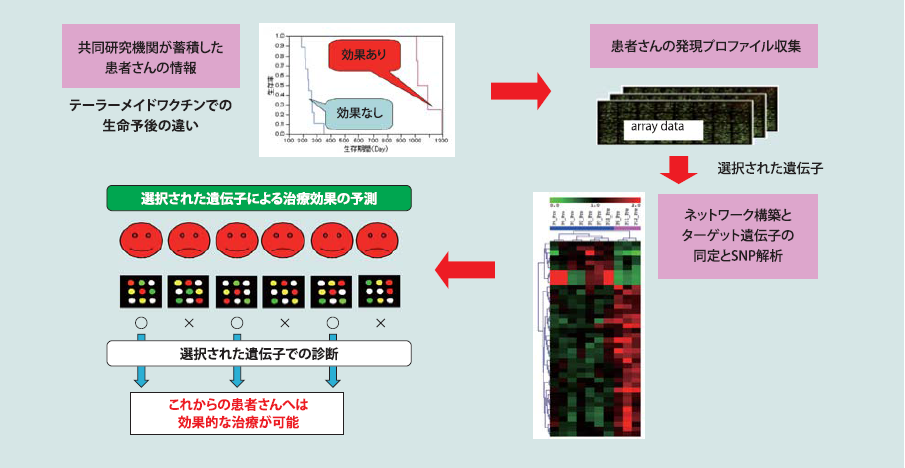
がんワクチンゲノミックスに基づくがんワクチン適格性予測診断キット及びがんワクチン副作用診断キットの研究開発
第4のがん治療法と言われているがんワクチン療法の有効性を高めるために、がんワクチンに対する各人の反応性や適格性を診断する診断キットを開発しています。これまで、久留米大学においてがんワクチン療法を試みている患者の血液をサンプルとして、ゲノムレベルでの解析を実施し、診断するための遺伝子マーカー、転写産物マーカー、さらに、タンパク質マーカーの同定に成功しました。現在、それらのがん治療における機能などを明らかにする研究を推進しています。これらを遂行するための技術的基盤は、上述したDNAマイクロアレイ解析と情報処理技術です。
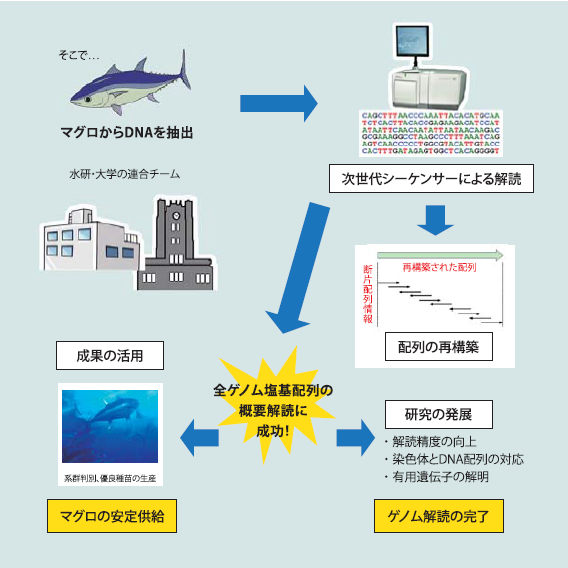
クロマグロの全ゲノム解析
マグロは速く、持続して高速で泳ぐことができるという優れた遊泳能力を持っており、数か月間海洋を遊泳しています。クロマグロは市場価値が高いため、乱獲されており、野生種の絶滅が危惧されています。野生捕獲したマグロ種苗に依存したマグロの完全養殖を確立するためには、人工的なブラッドストックの確立、そして生態的遺伝子ベースの系統および資源保護の達成のため、広範な分子遺伝学的情報の必要性が強く生じています。そこで、当研究室では、水産庁研究所と共同で研究を行い、クロマグロの全ゲノムシーケンスの解読に成功しました。これにより、マグロ筋組織に高エネルギー産生の仕組みが存在することや視覚関連遺伝子の解析から捕食時におけるマグロ特有の視覚能力の高さの原因などが判明しています。
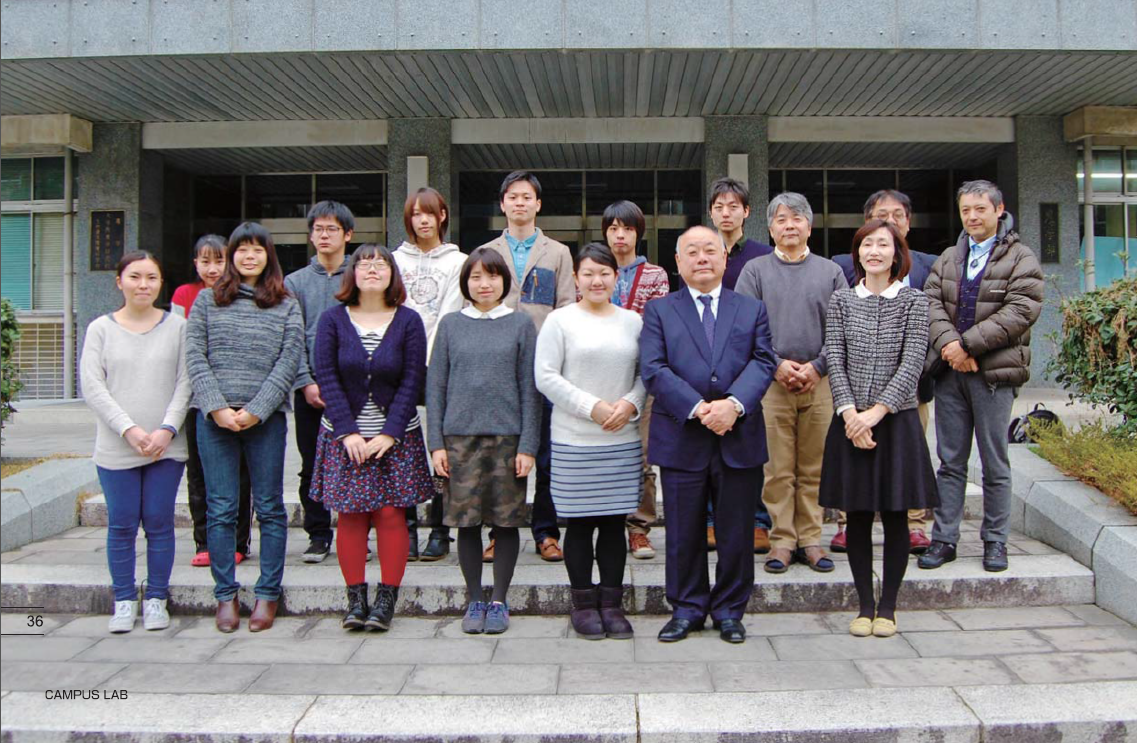
▲ 研究室の皆さん(久原先生を囲んで)
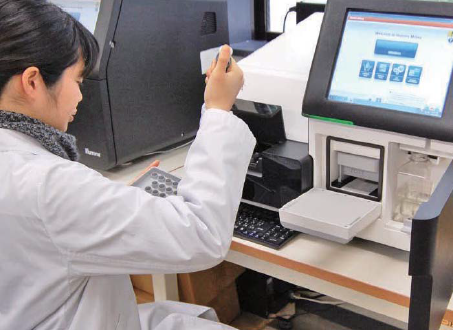
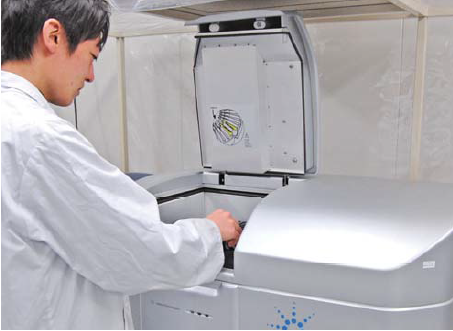
▲ 次世代シークエンサへのサンプルロード
▲ 細胞へのRNAマイクロインジェクション
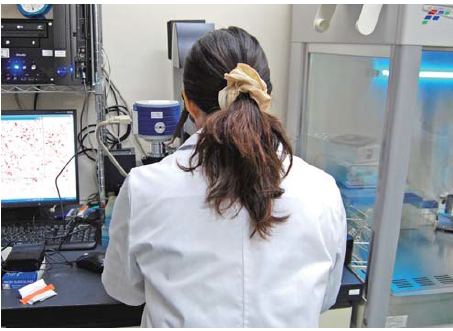
▲ DNAマイクロアレイによる遺伝子発現解析
▲ 蛍光顕微鏡による細胞観察
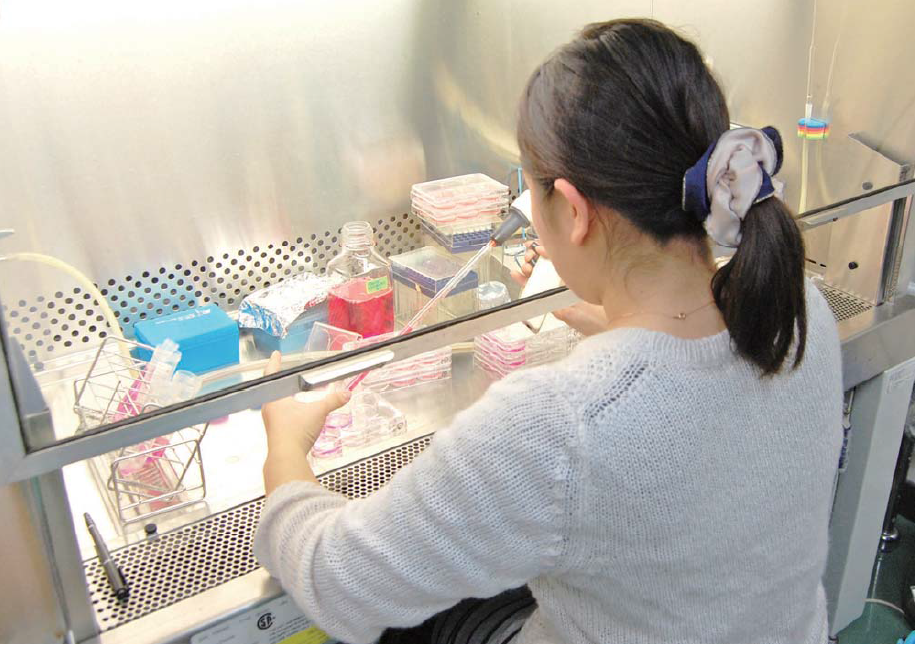
▲ 細胞培養のようす
「久原先生に聞く」
遺伝子発現を利用した生物機能開発
エレクトロニクスの進化がバイオを変えた
- Q1:先生がバイオインフォマティクスの開発を行なうきっかけはどのようなものだったのでしょうか?
- A1:ゲノムのシークエンスが可能になったことが起源ですね。簡単に言うなら生物の設計図が決定できるようになったとでも言うでしょうか。例えば、パン酵母が6000の遺伝子から構成されているということが1990年代に分かりました。それまでは、一部の遺伝子しか分かっていなかったため、大げさに言えば、大きな装置を調べるのに、大きな装置のねじの部分しか分かっておらず、それだけを調べていた状態だったのが、どれだけ大きな装置か全体像がやっと分かったというような感じですね。さらにその次の発展として、例えばヒトの遺伝子で3万個ということが分かり、さらに、この中のどの遺伝子がどれだけ使われているか観察できる「マイクロアレイ」という装置が開発されました。これによって、さらに生物全体の機能が理解できるようになりました。私にとって、生物全体の遺伝子の数と機能が分かるようになったということが、エポックメーキングでしたね。
効果的な薬の開発を
- Q2:先生の研究の将来的な展望と社会への影響を教えて下さい。
- A2:私達の研究が進むことで遺伝子ヒエラルキーが分かるようになります。これができると、例えば診断薬のマーカーとして使用することができます。例えば会社で例えると会社全体の動きが悪いとして、それがあるAという部署の動きが悪いためだと分かれば、A部だけをターゲットにした薬を作ればいいという風に、効果的な薬を開発することにも役立ちます。
その他、人間以外だと育種といって遺伝子を改良するということにも役立ちます。例えばイネの新種を作るのに通常は10~20年程度かかっていますが、これらが数年でできるようになるかもしれません。
ひらめきはアイスから?
- Q3:研究するにあたって様々な苦労があったかと思いますが、どんな苦労があったのでしょうか?
- A3:基本的に全てを楽しいと思いながら研究をしているため苦労という概念はあまりありません。ただ、あえて例として出すと、マイクロアレイの実験でガラスの上にポリエルリジンをコーティングして結合させるのですが、毎回安定せず、うまく結合出来なくて苦労していました。しかし、その頃、季節は夏でちょうどアイスを食べていて、「これだ!」とひらめきまして。実は一般のアイスにはカルボキシメチルセルロースという増粘剤が入っていてあのドロッとした感じを作っています。ふとこれを思い出して、実際に試したところ、安定しうまく結合できました。いつどんなところにひらめきや発見があるかは分かりませんね。
結果だけではなくプロセスも大事にする
- Q4:研究のうえで大事にされていることは何ですか?
- A4:データを詳細に眺めるということです。最近の装置は簡単に結果を出してくれます。しかし、それによって機械に頼りすぎてきているのではないか?とよく思います。結果だけではなく、どのようなプロセスでその結果が出ているのか?プロセスも大事にすることで見えてくるものもあるので、ローデータは大事にしていますね。
製品化までのスピード感を大事に
- Q5:ウシオとの共同開発などを進めていくうえで、ウシオに求めることなどありますか?
- A5:アイデアから製品化までのスピード感を大事にして欲しいです。日本企業全体に言えることですが、アメリカの企業に比べるとやっぱり遅いという感じはあります。早く開発しないとシェアの獲得というのは難しいと思います。過去の経験から、プロトタイプなんか、プロテクションが完璧ではなくてもスペックが出ればよいのに、余計なプロテクションまで作ったりして、開発が遅れたこともあり、もどかしいと思ったことも多いです。
もう一つは、異業種交流をどんどんやって欲しいです。遺伝子やバイオ研究者とその他の業種の交流というのは少ないですね。5年前の測定装置でもバイオの世界では、使えるものがたくさんあるのに、バイオの研究者は知らないことが多かったのです。測定・分析の世界では、低出力で耐久性が低く使えないと言われるものでも、「使い捨て」文化のあるバイオでは使えるものなど多いと思います。そんなことでも異業種交流がないと分からないんですよね。
他分野の常識、非常識を知ろう
- Q6:最後に若い人へ伝えたいことを教えて下さい。
- A6:「違う分野の人達と積極的にコミュニケーションを取って」と伝えたいです。バイオだけではなく、物理、化学、情報工学などの人達と友達になって欲しいです。そうすることで、他の分野での常識や非常識が分かります。それによって今のその分野でできないことが可能になる。その際は生物学の言葉ではなく、みんなの分かる共通の言語で伝えるというのも重要です。
遺伝子発現を利用した生物機能開発
Proc Nati Acad Sci USA. 2013 Jul 110(27) 11061-6.
Evolutionary changes of multiple
visual pigment genes in the complete
genome of Pacific bluefin tuna
Yoji Nakamuraa,1, Kazuki Morib, Kenji Saitoha, Kenshiro Oshimac, Miyuki Mekuchia, Takuma Sugayaa, Yuya Shigenobua,
Nobuhiko Ojimaa, Shigeru Mutab, Atushi Fujiwaraa, Motoshige Yasuikea, Ichiro Ooharaa, Hideki Hirakawad,
Vishwajit Sur Chowdhurye, Takanori Kobayashif, Kazuhiro Nakajimaf, Motohiko Sanoa,2, Tokio Wadaf,
Kosuke Tashirob, Kazuho Ikeog,h, Masahira Hattoric, Satoru Kuharab, Takashi Gojoborig,h,1, and Kiyoshi Inouyef
aResearch Center for Aquatic Genomics, National Research Institute of Fisheries Science, Fisheries Research Agency, Kanazawa, Yokohama 236-8648, Japan;
bDepartment of Bioscience and Biotechnology, Faculty of Agriculture, Kyushu University, Higashi-ku, Fukuoka 812-8581, Japan;
cDepartment of Computational Biology, Graduate School of Frontier Sciences, University of Tokyo, Kashiwa 277-8561, Japan;
dDepartment of Plant Genome Research, Kazusa DNA Research Institute, Kisarazu 292-0818, Japan;
eDivision for Arts and Science, Faculty of Arts and Science, Kyushu University, Nishi-ku Fukuoka 819-0395, Japan;
fFisheries Research Agency, Nishi, Yokohama 220-6115, Japan;
gCenter for Information Biology and DNA Data Bank of Japan, National Institute of Genetics, Mishima 411-8540, Japan; and
hDepartment of Genetics, School of Life Science, The Graduate University of Advanced Studies (SOKENDAI), Shonan
Village, Hayama, Kanagawa 240-0193, Japan
Edited* by Tomoko Ohta, National Institute of Genetics, Mishima, Japan, and approved May 20, 2013 (received for review February 2, 2013)
Tunas are migratory fishes in offshore habitats and top predators with unique features. Despite their ecological importance and highmarket values, the open-ocean lifestyle of tuna, in which effectivesensing systems such as color vision are required for capture ofprey, has been poorly understood. To elucidate the genetic andevolutionary basis of optic adaptation of tuna, we determined thegenome sequence of the Pacific bluefin tuna (Thunnus orientalis),using next-generation sequencing technology. A total of 26,433protein-coding genes were predicted from 16,802 assembled scaffolds.From these, we identified five common fish visual pigmentgenes: red-sensitive (middle/long-wavelength sensitive; M/LWS),UV-sensitive (short-wavelength sensitive 1; SWS1), blue-sensitive(SWS2), rhodopsin (RH1), and green-sensitive (RH2) opsin genes.Sequence comparison revealed that tuna's RH1 gene has an aminoacid substitution that causes a short-wave shift in the absorptionspectrum (i.e., blue shift). Pacific bluefin tuna has at least five RH2paralogs, the most among studied fishes; four of the proteinsencoded may be tuned to blue light at the amino acid level. Moreover,phylogenetic analysis suggested that gene conversions haveoccurred in each of the SWS2 and RH2 loci in a short period. Thus,Pacific bluefin tuna has undergone evolutionary changes in threegenes (RH1, RH2, and SWS2), which may have contributed todetecting blue-green contrast and measuring the distance to preyin the blue-pelagic ocean. These findings provide basic informationon behavioral traits of predatory fish and, thereby, could helpto improve the technology to culture such fish in captivity forresource management.
Tunas are considered “the ultimate fish,” because they are toppredators in ocean ecosystems, in addition to their uniquemorphology and physiology (1, 2). Worldwide, tunas have beenexploited because of their high market values, causing concernabout the state of the wild stocks (3). The investigation of the openoceanlifestyle of tuna is therefore a major issue from the view ofocean-wide resource management and conservation policies.
In general, a predatory lifestyle requires efficient sensing systemssuch as color vision. One of the important proteins for theanimal visual system is opsin (∼350 aa) of the retinylidene proteinfamily in pigment cells (4–7). The fish visual system includesfive opsin genes attributed to gene duplication: rhodopsin (RH1)in rod cells and four in cone cells: red-sensitive (middle/longwavelengthsensitive; M/LWS), UV-sensitive (short-wavelengthsensitive 1; SWS1), blue-sensitive (SWS2), and green-sensitive(RH2). Fish species often have multiple copies of opsin genes (6,7); for example, medaka has three RH2 genes (8), and guppy hasfour M/LWS genes (9). In addition, many fish species have twocopies of SWS2 genes, consistent with the concept that anancient duplication occurred and each copy has been retainedfor a long time. Previous studies have accumulated molecularinformation on opsins, focusing on the residues surrounding theretinal-binding pocket (10–12).
Many physiological studies have been conducted on fish visualsystem underwater (13, 14). As for tuna, spectrophotometricanalyses have demonstrated several wavelengths of maximal absorbance(λmax) in the visual pigments of yellowfin tuna (Thunnusalbacares) (15) and Pacific bluefin tuna (Thunnus orientalis) (16),respectively. However, little is known about the genetic basis andevolutionary history of tuna's optic adaptation to an open-oceanpredatory lifestyle. In this study, we have sequenced the draftgenome of Pacific bluefin tuna and analyzed the opsin genes ina phylogenetic framework to look for evidence of optic adaptationat the molecular level. The origins of tuna's opsin paralogs weredated by genome-wide comparison among the teleosts for whichgenomic information is available, and the relationship betweenthe evolutionary pathway of opsin genes and adaptation to oceanenvironment is discussed.
Results
Genome Sequencing and Gene Prediction.
The diploid genome ofa wild-caught male Pacific bluefin tuna (T. orientalis) was sequenced.A whole-genome shotgun sequencing and assembling strategy with a combination of Roche 454 FLX Titanium (RocheDiagnostics) and Illumina GaIIx platforms provided 192,169contigs (>500 bp) and 16,802 scaffolds (>2 kb) totaling 740.3Mb, corresponding to 92.5% of the estimated genome size (∼800Mb) (ref. 17; Table 1). The scaffolds were obtained by assembling31.9 million 454 reads, including 4.9 million paired ends(11.9-fold coverage) and 229.7 million Illumina paired-end reads (43-fold coverage) (Tables S1 and S2 and Fig. S1). Sequenceaccuracy of the scaffolds was improved by crosschecking those 454and Illumina reads whose error profiles were different from eachother (18). cDNA of 10 different tissues from an adult Pacificbluefin tuna were sequenced to identify coding gene regions in thescaffolds, recovering 5,741 full-length cDNA sequences out of180,512 contigs obtained from 3.8 million 454 reads (Table S3). Atuna-specific training model (19) was then constructed with cDNAof this study and ESTs of the Atlantic bluefin tuna (Thunnusthynnus) (20), as well as protein sequence alignments fromEnsembl fish genes (21). As a result, 26,433 protein-coding genecandidates were predicted in the scaffolds (Table 2 and Table S4).

Table 1. Overall metrics of the genome assembly and annotation of T.orientalis
Opsin Gene and Synteny.
A total of 13,023–14,542 orthologousgenes were identified by comparing the tuna data with thegenomes of six teleosts (Table 2) (21, 22). The largest numberof orthologs (14,542) was obtained by comparison with stickleback,which showed the highest protein identity (80.2% in themean, 82.5% in the median), suggesting that it may be the mostclosely related fish to tuna among the sequenced teleosts. Thisobservation is consistent with that in the previous study (23) inwhich stickleback has been shown to be close to Perciformes.Expanding the pairwise ortholog condition (i.e., reciprocal besthit) for multiple genomes, we obtained 6,170 core genes conservedamong the seven teleosts. From the core gene set, alltypes of opsin genes, M/LWS, SWS1, SWS2, RH1, and RH2were identified in the Pacific bluefin tuna genome. The orthologousrelationship was strongly supported by syntenies withother genomes, in which the neighboring genes are also conservedas orthologous gene pairs (Fig. 1A and Fig. S2A). Wefound that the Pacific bluefin tuna genome possessed 10 visualpigment genes: 5 for RH2, 2 for SWS2, and 1 each for SWS1,M/LWS, and RH1. All of the opsin genes were expressed in thewhole eye of a juvenile Pacific bluefin tuna (Fig. 1B). In a previousstudy, only two RH2, one RH1, and one SWS2 genes wereidentified in Pacific bluefin tuna (24); thus, three more RH2, onemore SWS2, and single SWS1 and M/LWS genes were identifiedin this study. Of five RH2 genes, three (RH2B, g6738, andg6740) are transcribed in the same direction, whereas the others(RH2A1 and RH2A2) are on the opposite strand. One of theneighboring genes of the RH2 locus [solute carrier family 6,member 13 (slc6a13) in zebrafish] was not identified at thescaffold end but was detected in another scaffold end. Therefore,there might be more than five RH2 copies, although we didnot find any significant RH2 homologs from other scaffolds orread sequences.
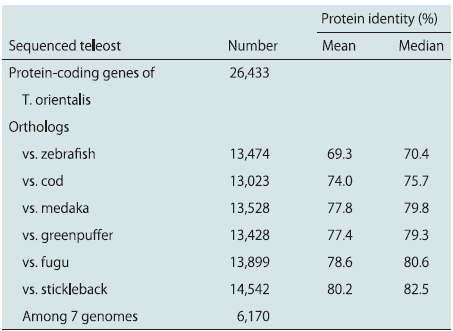
Table 2. Gene comparison among teleost genomes
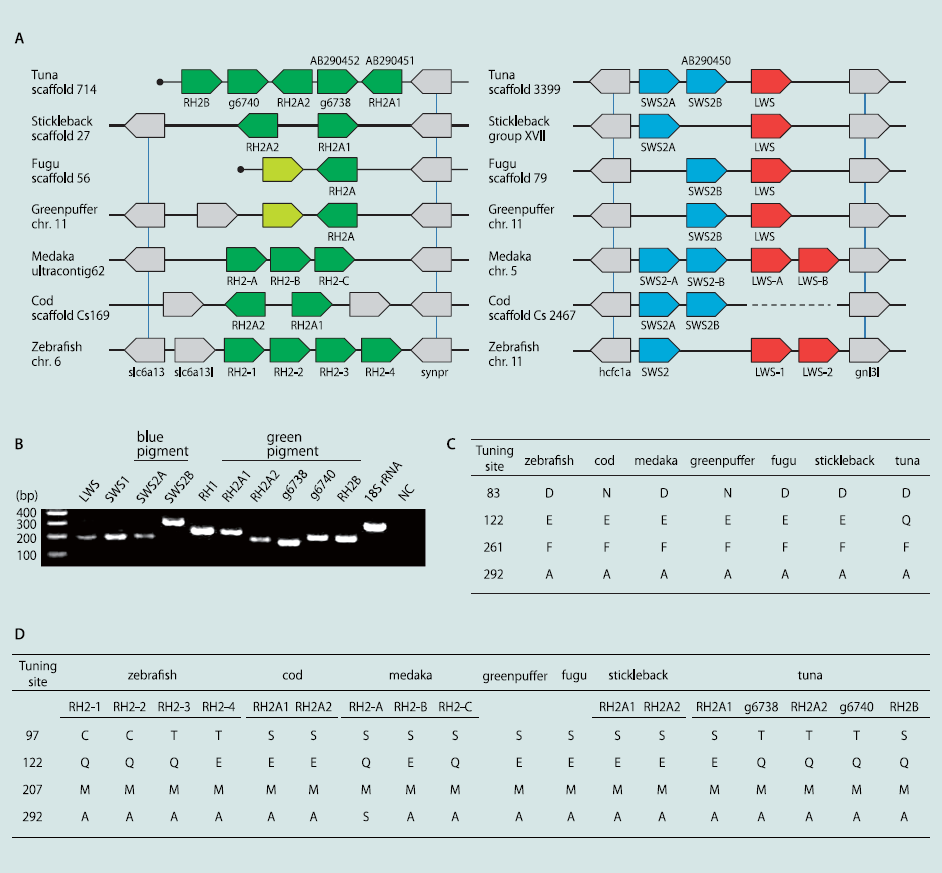
Fig. 1 Synteny of opsin gene loci and spectral tuning sites. (A) Synteny of green (Left), blue, and red (Right) visual pigment genes compared with six teleostswhose genomes have been sequenced. Colors indicate different gene families (e.g., green for green pigment genes, blue for blue pigments, and red for redpigments). Gray-colored genes flank the pigment genes, and vertical bars indicate orthology. Previously identified genes in tuna are denoted with theirGenBank accession nos. (AB290450–AB290452). The light green-colored green pigment genes of two pufferfishes are pseudogenes (30). The gene names inzebrafish and medaka comply with previous studies, and others are named in this study (g6738/g6740 of tuna are named in the order of genes predicted inscaffolds). The cod scaffold containing blue pigment genes has a gap. Filled circles indicate the scaffold ends. Each gene is arranged in consideration oftranscriptional direction, and the physical distance is ignored. (B) Expression of all opsin genes in a juvenile tuna. The 18S ribosomal RNA gene was used asa positive control. (C and D) Representative amino acid sites involved in the light sensitivity of rhodopsin (C) and green opsin (D) (44) in comparison with seventeleosts. The site numbers are standardized to those of bovine rhodopsin (45). The residues of other tuning sites are summarized in Fig. S2C.
Opsin Sequence Comparison and Phylogenetic Analysis.
Fish opsinsequences were extracted from the public databases and comparedwith the sequences of Pacific bluefin tuna. Based on multiplealignments, we surveyed the amino acid sites involved inlight sensitivity (Fig. 1 C and D and Fig. S2C). Spectral tuningsites of RH1 are almost identical among sequenced fish species;however, a tuna-specific amino acid was observed at site 122(glutamine; Q), whereas other teleost genomes have glutamicacid (E). Glutamine at site 122 was widely conserved among thesuborder Scombroidei containing the family Scombridae (e.g.,tuna, mackerel, and bonito) (Fig. S2B), as well as coelacanth andlampfish (25, 26). Moreover, in four of five RH2 genes, we foundamino acid substitutions at sites known for spectral tuning (11):E to Q at site 122.
Phylogenetic analysis demonstrated that two pairs of greenpigment genes, RH2A1/A2 and g6738/g6740, were recently duplicated,and that RH2A1/A2 and RH2B fall into distinct clusters,namely, RH2A and RH2B, respectively (Fig. 2 A, Left). TheRH2 genes of medaka, guppy, and cichlid are in each cluster;therefore, the origin of RH2A1/A2 and RH2B is probably commonto these fishes, before the appearance of the superorderAcanthopterygii. In particular, considering the position of the codRH2 genes, the origin of RH2A and RH2B might predate thedivergence of the Acanthopterygii and the Paracanthopterygii,and, subsequently, RH2B was lost in cod. A recently duplicatedpair, g6738/g6740, seems to be a lone group in the phylogenetictree, and a robust position for this pair was not found. Interestingly,high local similarities were found at the C-terminalregions between RH2B and g6738/g6740 sequences by a windowanalysis (Fig. S3 A, Left). This observation implies a sequencehomogenization by gene conversion, which can also explain theunstable position of g6738/g6740. Therefore, the phylogenetictree of RH2 genes was reconstructed by using only C-terminalsequences (average length: 112 aa), which placed g6738/g6740significantly closer to RH2B2 (Fig. 2 A, Right), whereas the treeof N-terminal sequences was similar to that of the full sequences(Fig. S3B). All pairs of tuna RH2 genes exhibited nonsynonymous/synonymous substitution ratios (dN/dS; a measure for selection)of <1; therefore, these genes have maintained their functionsunder purifying selection (Table S5).
The sequences of tuna SWS2 were found to be different fromother teleosts among the predicted spectral tuning sites (sites94 and 116) (ref. 27; Fig. S2C). Phylogenetic analysis showedthat two copies of the tuna SWS2 were predicted to fall intodistinct and large clades like those of other fishes (e.g., medakaand cichlid) (Fig. 2 B, Left), indicating that both tuna SWS2 genescome from an ancient gene duplication. The dN/dS between thetwo SWS2 copies was also <1 (0.1964) (Table S5). Moreover, wefound that tuna SWS2 genes were highly similar to each other atC-terminal regions (average length: 123 aa), such as RH2B andg6738/g6740 (Fig. S3 A, Right). We then constructed the phylogenetictrees for the subsequences (Fig. 2 B, Right) and obtained thetopologies suggestive of a gene conversion in the tuna SWS2 locus.With reference to M/LWS, in which five sites are major determinantsof optimum light sensitivity (λmax) (12), tuna has thesame amino acids as medaka and stickleback (S, H, Y, T, and A) (Fig. S2C). Thus, following the five-sites rule, the λmax of tunaM/LWS is inferred to be similar to that of medaka, at ∼560 nm.Unlike M/LWS, significant insights into the tuning sites of SWS1are not gained (Fig. S2C); there are no simple rules, althougha previous study has shown that site-directed mutations causewavelength shifts (28).
To date the duplication events of opsin genes, the divergencetime of seven teleost species in Table 2 was initially calibratedby using nucleotide substitution rates between orthologous genes.Here, we used the synonymous substitution rate (dS), whichreflects the molecular evolution in a neutral manner (29). First,4,991 of 6,170 core genes common to the seven teleost genomes(Table 2) were selected according to the criterion that the dS ofany orthologous pair was computable. The mean dS values werethen computed among the seven genomes and plotted vs. thedivergence times (Fig. 3A and Table S6). A linear correlation wasobserved between the divergence time and mean dS, and the clockwas estimated as 2.5 x 10⁻⁹ per site per year. The dS values foreach of RH2A/B pairs in tuna, guppy, medaka, and cichlids wereestimated, and the mean was 0.92 (Table S5). The dS values ofrecent duplicate pairs were 0.11 for RH2A1/A2 and 0.16 forg6738/g6740. Similarly, the mean dS of SWS2A/B was 0.95.Based on the regression formula, the estimated duplication times(with a 95% confidence interval) were 183 (163–203) millionyears ago (Mya) for RH2A/B, 22 Mya (13–31 Mya) for RH2A1/A2, 32 Mya (21–43 Mya) for g6738/g6740, and 189 Mya (168–211 Mya) for SWS2A/B (Fig. 3B). We also applied the formulafor estimating the time of gene conversion in each of the RH2and SWS2 genes, using the C-terminal alignments; the averagedS value between RH2B and g6738/g6740 was 0.29, correspondingto 58 Mya (38–79 Mya). In the case of SWS2A/B, thedS value was 0.13 (12–41) Mya. Thus, the time of gene conversionbetween SWS2 genes may be close to the time of birthof recent RH2 duplicates.
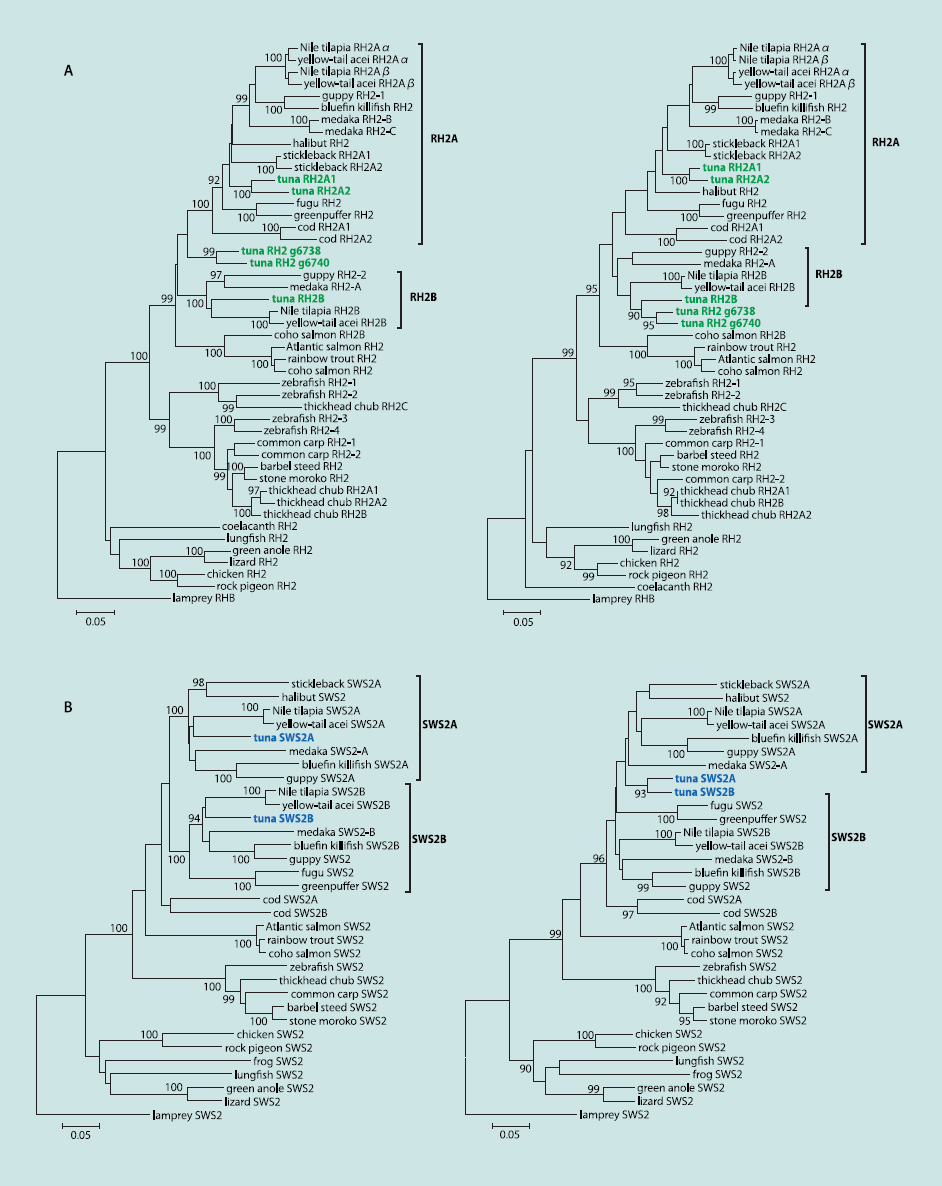
Fig. 2. Phylogenetic trees of green and blue pigment genes. Numbers at branches indicate the bootstrap probabilities (≥90%) with 1,000 replicates. (A) Treesof green pigment genes. Tuna RH2 genes are shown in green. Note that the previously named RH2-A/B genes of medaka do not correspond to cichlid RH2A/B,and the tuna RH2A/B correspond to the cichlid genes. The trees were constructed by using full sequences (Left) and C-terminal sequences (Right), respectively.(B) Trees of blue pigment genes: full sequences (Left) and C-terminal sequences (Right). Tuna SWS2 genes are shown in blue.
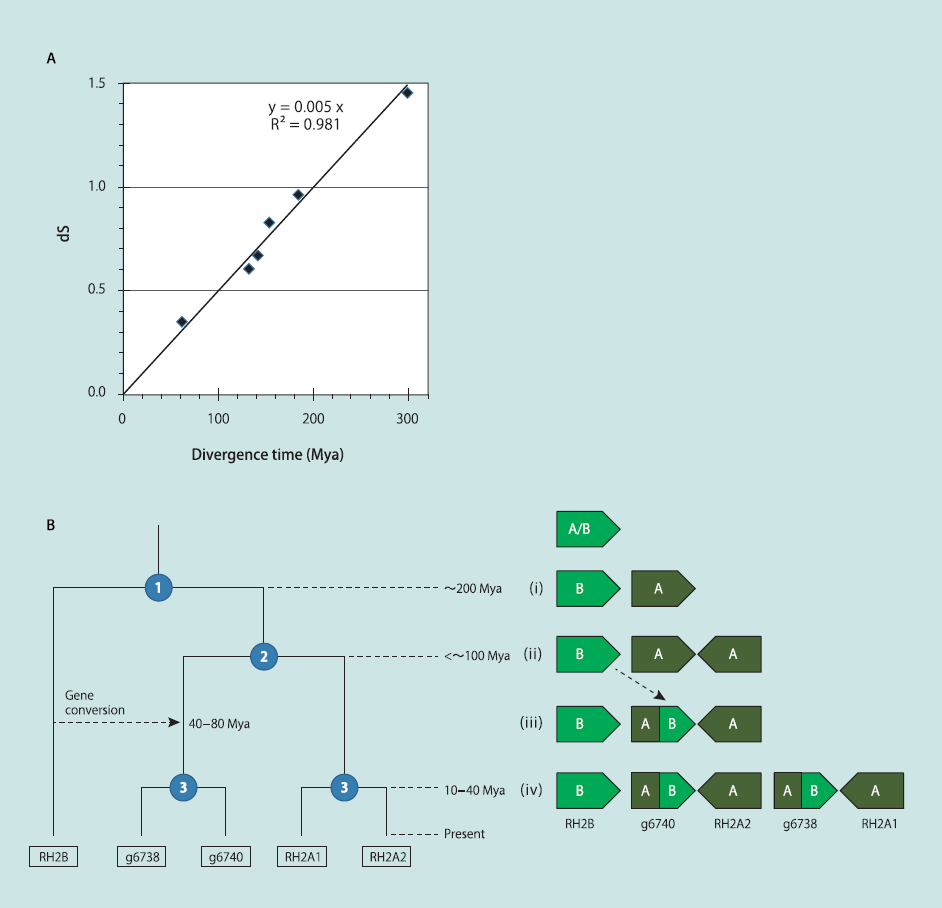
Fig. 3. Calibration of divergence time among teleosts and evolutionary scenario of green pigment genes in T. orientalis. (A) The relationship betweendivergence time and the synonymous substitution rate (dS). The divergence times are based on previous studies (Table S6). The mean dS values werecomputed by using 4,991 of 6,170 core genes among seven teleost genomes. (B) A proposed evolutionary pathway of tuna RH2 genes. Each node witha number in the dendrogram (Left) indicates a duplication event. Right shows a diagram of the changes to the RH2 locus structure during the course ofevolution. The duplication times were estimated by the regression formula computed in A.
Discussion
Genetic Feature of the Tuna Visual System.
In this study, all fiveopsins (M/LWS, SWS1, SWS2, RH1, and RH2) were identifiedin the Pacific bluefin tuna genome. Recently, three light absorptionpeaks (λmax: 423–436, 473, and 512–515 nm) were estimated for visual pigments of juvenile Pacific bluefin tuna,corresponding to at least one SWS2 and two RH2 genes,respectively (16), but such a color sensitivity in tuna may beexplained by the combinatorial function of more opsin genes. Inparticular, five green pigment genes are present in the tuna genome,whereas the other six teleost genomes sequenced to datehave only one to four genes (8, 21, 22, 30). This number is thehighest among the sequenced fish species, and three of the fivegenes are identified in this study. Thus, one can speculate that theabundance of RH2 genes is involved in the tuna-specific visual system.Previous studies demonstrated that the expression patternof fish opsins might be regulated spatially, as well as temporally, in the retina (31–33). In the case of zebrafish, shorter-wavelengthRH2 proteins are first expressed in the central part of the retina,whereas longer wavelength proteins are expressed later in theperipheral part (34). Similarly, the five RH2 genes of tuna mightbe differentially expressed in retina, which would contribute to thevisual diversification of tuna. Although the two known RH2 genesare expressed in the retina of juvenile Pacific bluefin tuna (24), wefound that the other three were also expressed in the eye. It shouldbe noted that tuna has been shown to change the light sensitivitywith growth in the spectrophotometric studies (15, 35). Thus,the expression control of tuna's opsin genes at different developmentalstages might contribute to the fine tuning of color vision inthe bluish ocean.
At the molecular level, specific amino acid patterns were foundat spectral tuning sites for both of RH1 and RH2 genes. In RH1,the amino acid at site 122 was glutamine, whereas other teleostspossess glutamic acid. A previous study using site-directed mutagenesisdemonstrated that the E122Q replacement in coelacanthRH1 causes a short-wave shift of the pigments (i.e., blueshift) (25). This pattern is often observed in deep-sea fishesirrespective of lineage, involving an adaptation to dark environments(26, 36). The present study demonstrated that this patternis well conserved in the suborder, Scombroidei, suggesting thatthe amino acid was substituted to Q from E in an ancestor of thislineage. Many of the species in Scombroidei are not deep-seadwellers but are open water predators. Regarding the RH2 genes,in which Q122E replacement shifts the absorption toward red(11), four of the five genes in tuna might be shifted to a shorterwavelength than the other because of Q at site 122. Therefore, wepropose that these E122Q substitutions in tuna RH1 and RH2may contribute to effective detection of prey in the bluish ocean.
Evolution of Tuna Blue-Green Genes.
The phylogenetic analysisshowed that an ancient duplication of fish green pigment geneinto RH2A and RH2B occurred before the divergence of theAcanthopterygii. This duplication was estimated to have occurred∼180 Mya (163–203 Mya), based on the synonymous substitutionrates. Thus, the emergence of RH2A and RH2B may predate thedivergence of the Acanthopterygii and the Paracanthopterygii(∼160 Mya) (23, 37). Here, the duplication of the SWS2 genes isalso estimated to have occurred ∼190 Mya (168–211 Mya), nearthe time of the RH2 duplication. These estimates are consistentwith those from published reviews (6, 7), suggesting that the calibrationby synonymous substitution rates using genome-wideortholog pairs is effective. Regarding recent duplicate pairs oftuna RH2 genes, the dS values are similar for each pair (RH2A1/RH2A2, 0.11; g6738/g6740, 0.16). Taking into account the geneorder and corresponding directions of transcription, it is likelythat these pairs originated simultaneously from a single tandemduplication (∼10–40 Mya). The duplication of RH2A was estimatedto have occurred ∼92 Mya (79–105 Mya), with a mean dS = 0.46(Table S5); however, this date (92 Mya) is probably an overestimate,because the C-terminal sequences of g6738/g6740 werereplaced by that of RH2B through gene conversion (38–79 Mya).In addition to the RH2 genes, we obtained evidence of a recentgene conversion between SWS2 genes (12–41 Mya). Because thealignments examined were partial and short (∼110–120 aa), furtheranalysis is needed to accurately estimate the times of geneconversion. Interestingly, g6738/g6740 is still a lone group evenin the tree of N-terminal regions (Fig. S3B), suggesting that theduplication of RH2A1/A2 and g6738/g6740 might be specific tothe Scombridae/Scombroidei or the Perciformes.
In the present study, we propose the following evolutionarypathway of RH2 genes in tuna based on parsimony, in which geneduplication and conversion events are minimized to three and one,respectively (Fig. 3B). (i) An RH2 gene was duplicated into RH2Aand RH2B before the divergence of the Paracanthopterygii andthe Acanthopterygii (∼200Mya). (ii) An inverted duplication thenoccurred in the RH2A lineage (<∼100 Mya). (iii) Gene conversionpartially replaced one of the RH2A copies by a counterpartfrom the RH2B lineage (40–80 Mya). (iv) A tandem duplicationdoubled two copies to four (10–40 Mya). If the gene inversionand duplication in stage ii occurred separately, a gene fusion bydeletion could also account for the RH2 evolution by three duplications(Fig. S3C). Under any scenario, we can argue that RH2increased from three to five copies in stage iv in a relatively shortperiod. In a previous study, the divergence time of Thunnus andScomber (mackerel) is inferred to be ∼80 Mya (37), suggestingthat RH2 copy number variation and both conversions in RH2and SWS2 may have arisen within the Scombridae/Scombroideiand may be different between tuna and other closely related species,such as mackerel and bonito.
We have thus observed that molecular evolutionary changesin three opsin genes, RH1, RH2, and SWS2, may have occurredaround the time when the ancestor of tuna appeared or diverged.All of the changes are involved in blue-green light sensitivity. InPacific bluefin tuna, particularly, not only stepwise duplications ofRH2 genes but also gene conversions in such multicopy genes(including SWS2) may have facilitated the functional diversificationof spectral tuning to the offshore environment, which areuseful for detecting bluish contrasts. Moreover, each opsin is ingeneral considered to be expressed in a single pigment cell inthe retina; therefore, the difference in blue-green light sensitivitycan lead to a lag in focal distances among blue or green pigmentcells. Although fish camouflage mechanism underwater is complicated(38), tuna RH2 and SWS2 copies might be used formeasuring the distance to blue-backed fishes in the bluish oceanas well as for improving dynamic vision.
Impact of Tuna Genome Sequencing.
Our study represents a tunagenome assembly, which has not been described previouslyand which provides significant insight into the genetic and evolutionary background of the optic adaptation of Pacificbluefin tuna. These findings will shed light on behavioral traitsof predatory fish in the open ocean. In tuna aquaculture, forexample, a high mortality due to wall collisions has beenproblematic (39), which can be considered as an adverse consequenceof adaptation to the bluish pelagic environment. Thefindings we present here are thus applicable for design of tunafarms: perceptible and high-contrast coloring. In particular,because tuna is still difficult to culture and handle for experimentalapproaches, genomics strategy is widely expected tocomplement physiological studies on tuna. Genomic informationfrom a wide range of pelagic organisms such asbluefin tunas will provide significant clues for comprehensiveunderstanding of the diversity of those organisms.
Materials and Methods
Detailed methods are described in SI Materials and Methods.
Genome Sequencing.
Genomic DNAs of Pacific bluefin tuna were extractedfrom a male individual reared in Amami, Japan, and the sequence templatesfor 454 and Illumina sequencing were prepared followed the manufacturers’instructions. The de novo genome assembly and gene prediction are describedin SI Materials and Methods. The T. orientalis whole-genome assemblysequences have been deposited in the DNA Data Bank of Japan/EuropeanMolecular Biology Laboratory/GenBank (accession nos. BADN01000001–BADN01133062).
Gene Comparison.
Genomic data from the six teleosts, zebrafish (Danio rerio),cod (Gadus morhua), medaka (Oryzias latipes), greenpuffer (Tetraodonnigroviridis), fugu (Takifugu rubripes), and stickleback (Gasterosteus aculeatus),were downloaded from the Ensembl database (Release 61). All-vs.-all BLASTPwas performed among the seven teleost genes (Ensembl fishes and tuna)with an E-value < 10−10. An orthologous gene pair was defined as one reciprocalbest hit. Each of the core genes conserved among seven teleost fisheswas defined as the gene set in which any pair was defined as orthologous.
Phylogenetic Analysis.
Opsin gene sequences from other fishes and animalswere collected from the GenBank (40) and Ensembl databases (listed in SIMaterials and Methods). The detailed methods for multiple alignment (41),computation of synonymous and nonsynonymous substitution rates (42), andmolecular phylogenetic tree (43) are described in SI Materials and Methods.
ACKNOWLEDGMENTS.
S. Shiozawa and members of the Tuna Seed ProductionGroup, Seikai National Fisheries Research Institute (Fisheries ResearchAgency; FRA), kindly provided the tuna tissue specimens for sequencing.We thank K. Furuya, C. Shindo, H. Inaba, E. Iioka, Y. Takayama, E. Ohmori,M. Kikuchi, W. Suda, and Y. Hattori for technical support. S. Song and theRoche Diagnostics technical support team helped us operate the sequencingmachine. Drs. Y. Sakaki, H. L. Bart, Jr., M. H. Doosey, and S. Yokoyama providedinvaluable comments on the manuscript. This research was partly supportedby general research and a facility setting-up funds to the FRA fromthe Fisheries Agency (Ministry of Agriculture, Forestry and Fisheries, Japan);and Ministry of Education, Culture, Sports, Science and Technology (Japan)Grants-in-Aid for Scientific Research on Priority Areas “ComprehensiveGenomics,” on Innovative Areas ”Genome Science,” and the global Centerof Excellence Project “Genome Information Big Bang.”
プロフィール

久原 哲 (くはら さとる)
九州大学大学院農学研究院
生命機能科学部門システム生物工学
講座遺伝子制御学分野 教授
(連絡先) 〒812-8581
福岡県福岡市東区箱崎6-10-1
TEL 092-642-3041
FAX 092-642-3043
学 位:農学博士(九州大学)
専門分野:生命科学、
バイオインフォマティクス
- 経 歴
- 昭和49年3月 九州大学農学部 農芸化学科 卒業
51年3月 九州大学大学院農学研究科 修士課程 修了
55年3月 九州大学大学院農学研究科 博士課程 単位取得後退学
56年8月 学位 農学博士(九州大学)取得
昭和57年3月 九州大学 助手(農学部) 採用
平成01年4月 九州大学大学院農学研究科 助教授に昇任
7年8月 九州大学大学院農学研究科 教授に昇任
(平成22年4月~ 九州大学有体物管理センター長 兼任) - 研究歴
- 昭和49年4月~昭和51年3月 酵素反応システムのシミュレーションについて研究
昭和51年4月~昭和55年3月 酵素反応システムの最適制御について研究
昭和55年4月~平成元年3月 核酸データーベースGENUSについて研究
平成元年4月~現在 遺伝子発現制御ネットワークについて研究(ゲノム解析、SNP解析等行う) - 受 賞
- 平成3年 データーベース創造賞
平成7年 情報処理学会論文賞
平成7年 人工知能学会基礎論研究会奨励賞
平成25年3月 日本農芸化学会功績賞受賞 - 委員会
- ○日本学術会議連携会員(農芸化学分科会、バイオインフォマティクス分科会)
○日本学術振興会産学協力研究委員会「ゲノムテクノロジー第164委員会」委員
○福岡県バイオ産業拠点推進会議 企画委員会委員長 - 学 会
- ○日本分子生物学会、日本バイオインフォマティクス学会、DNA鑑定学会(理事)
○日本ゲノム微生物学会(評議員) - 業 績
- Yoji Nakamura, Kazuki Mori, Kenji Saitoh, Kenshiro Oshima, Miyuki Mekuchi, Takuma Sugaya, Yuya Shigenobu, Nobuhiko Ojima, Shigeru Muta, Atushi Fujiwara, Motoshige Yasuike, Ichiro Oohara, Hideki Hirakawa, Vishwajit Sur Chowdhury, Takanori Kobayashi, Kazuhiro Nakajima, Motohiko Sano, Tokio Wada, Kosuke Tashiro, Kazuho Ikeo, Masahira Hattori, Satoru Kuhara, Takashi Gojobori, and Kiyoshi Inouye.
Evolutionary changes of multiple visual pigment genes in the complete genome of Pacific bluefin tuna. Proc Natl Acad Sci U S A. (PROCEEDINGS OF THE NATIONAL ACADEMY OF SCIENCES OF THE UNITED STATES OF AMERICA)
Jul 2;110(27):11061-11066.(2013)
Ohtani K, Hirakawa H, Paredes-Sabja D, Tashiro K, Kuhara S, Sarker MR, Shimizu T. Unique regulatory mechanism of sporulation and enterotoxin production in Clostridium perfringens.Journal of Bacteriology. 195(12):2931-2936. (2013)
Pang X, Tashiro K, Eguchi R, Komatsu N, Sasada T, Itoh K, Kuhara S.(2013)
Haptoglobin Proved a Prognostic Biomarker in Peripheral Blood of Patients with Personalized Peptide Vaccinations for Advanced Castration-Resistant Prostate Cancer. Biosci Biotechnol Biochem. 77(4):766-770 (2013)
Affara M, Sanders D, Araki H, Tamada Y, Dunmore BJ, Humphreys S, Imoto S, Savoie C, Miyano S, Kuhara S, Jeffries D, Print C, Charnock-Jones DS. Vasohibin-1 is identified as a master-regulator of endothelial cell apoptosis using gene network analysis. BMC Genomics. 16;14:23.(2013)
Komatsu N, Matsueda S, Tashiro K, Ioji T, Shichijo S, Noguchi M, Yamada A, Doi A, Suekane S, Moriya F, Matsuoka K, Kuhara S, Itoh I, and Sasada T. Gene expression profiles in peripheral blood as a biomarker in cancer patients receiving peptide vaccination. Cancer. 15;118(12):3208-21 (2012)
Takahiro OBA, Hikaru SUENAGA, Shunichi NAKAYAMA, Shinji MITSUIKI, Hiroshi KITAGAKI, Kosuke TASHIROand Satoru KUHARA, Properties of a High Malic Acid-Producing Strains of Saccharomyces cerevisiae Isolated from Sake Mash. Bioscience, Biotechnology, and Biochemistry, 75(10), 2025-9. (2011)
Emi Yoshigai, Shinobu Kawamura, Satoru Kuhara and Kosuke Tashiro, Trim36/Haprin plays a critical role in the arrangement of somites during Xenopus embryogenesis, Biochemical and Biophysical Research Communications, 378, 428-432 (2009)
Michio Asada, Hideki Hirakawa, Satoru Kuhara, Classification of Bacteria Based on the Biases of Terminal Amino Acid Residues. Protein J 30:290–2971. (2011)
Machida M, Asai K, Sano M, Tanaka T, Kumagai T, Terai G, Kusumoto K, Arima T, Akita O, Kashiwagi Y, Abe K, Gomi K, Horiuchi H, Kitamoto K, Kobayashi T, Takeuchi M, Denning DW, Galagan JE, Nierman WC, Yu J, Archer DB, Bennett JW, Bhatnagar D, Cleveland TE, Fedorova ND, Gotoh O, Horikawa H, Hosoyama A, Ichinomiya M, Igarashi R, Iwashita K, Juvvadi PR, Kato M, Kato Y, Kin T, Kokubun A, Maeda H, Maeyama N, Maruyama J, Nagasaki H, Nakajima T, Oda K, Okada K, Paulsen I, Sakamoto K, Sawano T, Takahashi M, Takase K, Terabayashi Y, Wortman JR, Yamada O, Yamagata Y, Anazawa H, Hata Y, Koide Y, Komori T, Koyama Y, Minetoki T, Suharnan S, Tanaka A, Isono K, Kuhara S, Ogasawara N, Kikuchi H. Genome sequencing and analysis of Aspergillus oryzae. Nature. 438(7071),1157-1161(2005)
Kuroda M, Yamashita A, Hirakawa H, Kumano M, Morikawa K, Higashide M, Maruyama A, Inose Y, Matoba K, Toh H, Kuhara S, Hattori M, Ohta T.
Whole genome sequence of Staphylococcus saprophyticus reveals the pathogenesis of uncomplicated urinary tract infection. Proc Natl Acad Sci U S A. 13,102,13272-7. (2005)
Imoto S, Kim S, Goto T, Miyano S, Aburatani S, Tashiro K, Kuhara S.
Bayesian network and nonparametric heteroscedastic regression for nonlinear modeling of genetic network. J Bioinform Comput Biol. 1(2):231-52.(2003)
Imoto S, Savoie CJ, Aburatani S, Kim S, Tashiro K, Kuhara S, Miyano S.
Use of gene networks for identifying and validating drug targets. J Bioinform Comput Biol.
1(3):459-74.( 2003)
Imoto S, Higuchi T, Goto T, Tashiro K, Kuhara S, Miyano S. Combining microarrays and biological knowledge for estimating gene networks via bayesian networks. J Bioinform Comput Biol.
2(1):77-98.(2004)
Ohta T, Hirakawa H, Morikawa K, Maruyama A, Inose Y, Yamashita A, Oshima K, Kuroda M, Hattori M, Hiramatsu K, Kuhara S, Hayashi H.
Nucleotide substitutions in Staphylococcus aureus strains, Mu50, Mu3, and N315.
DNA Res.,11(1):51-6. (2004)
Savoie CJ, Aburatani S, Watanabe S, Eguchi Y, Muta S, Imoto S, Miyano S, Kuhara S, Tashiro K. Use of gene networks from full genome microarray libraries to identify functionally relevant drug-affected genes and gene regulation cascades.
DNA Res. 10(1):19-25 (2003)
Aburatani S, Tashiro K, Savoie CJ, Nishizawa M, Hayashi K, Ito Y, Muta S, Yamamoto K, Ogawa M, Enomoto A, Masaki M, Watanabe S, Maki Y, Takahashi Y, Eguchi Y, Sakaki Y, Kuhara. Discovery of novel transcription control relationships with gene regulatory networks generated from multiple-disruption full genome expression libraries. DNA Res. 10(1):1-8. (2003)
Shimizu T, Ohtani K, Hirakawa H, Ohshima K, Yamashita A, Shiba T, Ogasawara N, Hattori M, Kuhara S, Hayashi H. Complete genome sequence of Clostridium perfringens, an anaerobic flesh-eater. Proc Natl Acad Sci U S A. 99(2):996-1001.(2002)
Kuroda M, Ohta T, Uchiyama I, Baba T, Yuzawa H, Kobayashi I, Cui L, Oguchi A, Aoki K, Nagai Y, Lian J, Ito T, Kanamori M, Matsumaru. Kuroda M, Ohta T, Uchiyama I, Baba T, Yuzawa H, Kobayashi I, Cui L, Oguchi A, Aoki K, Nagai Y, Lian J, Ito T, Kanamori M, Matsumaru H, Maruyama A, Murakami H, Hosoyama A, Mizutani-Ui Y, Takahashi NK, Sawano T, Inoue R, Kaito C, Sekimizu K, Hirakawa H, Kuhara S, Goto S, Yabuzaki J, Kanehisa M, Yamashita A, Oshima K, Furuya K, Yoshino C, Shiba T, Hattori M, Ogasawara N, Hayashi H, Hiramatsu K. Whole genome sequencing of meticillin-resistant Staphylococcus aureus. Lancet. 357(9264):1225-40.(2001) - 連絡先
- 〒812-8581 福岡市東区箱崎6-10-1
九州大学大学院農学研究院
生命機能科学部門システム生物工学講座遺伝子制御学分野
TEL:092-642-3041 FAX:092-642-3043
関連製品

論文を探す

今号では、レーザープロジェクターにおけるスペックルの低減技術、三次元計測技術向け開発したデジタルホログラフィック顕微鏡、ポイントリーダーを用いての血清フェリチンの測定など、エレクトロニクスやライフサイエンス分野に関する5件の論文、プレゼンテーション資料を掲載いたしました。
シリーズ「大学研究室を訪ねて」では、前号に続き、九州大学大学院 農業研究院 生命機能科学部門の久原教授、田代准教授をお訪ねし、遺伝子と遺伝子発現制御に関する研究や、コンピュータによる蛋白質高次構造の推定とデータベース構築の研究をご紹介しております。
(2015年05月)